Ogmore
Ogmore is a historic hundred in the county of Glamorgan. It was number 10 out of 10 (in population) in the county of Glamorgan and number 82 out of 90 in all of Wales.
Basic Statistics
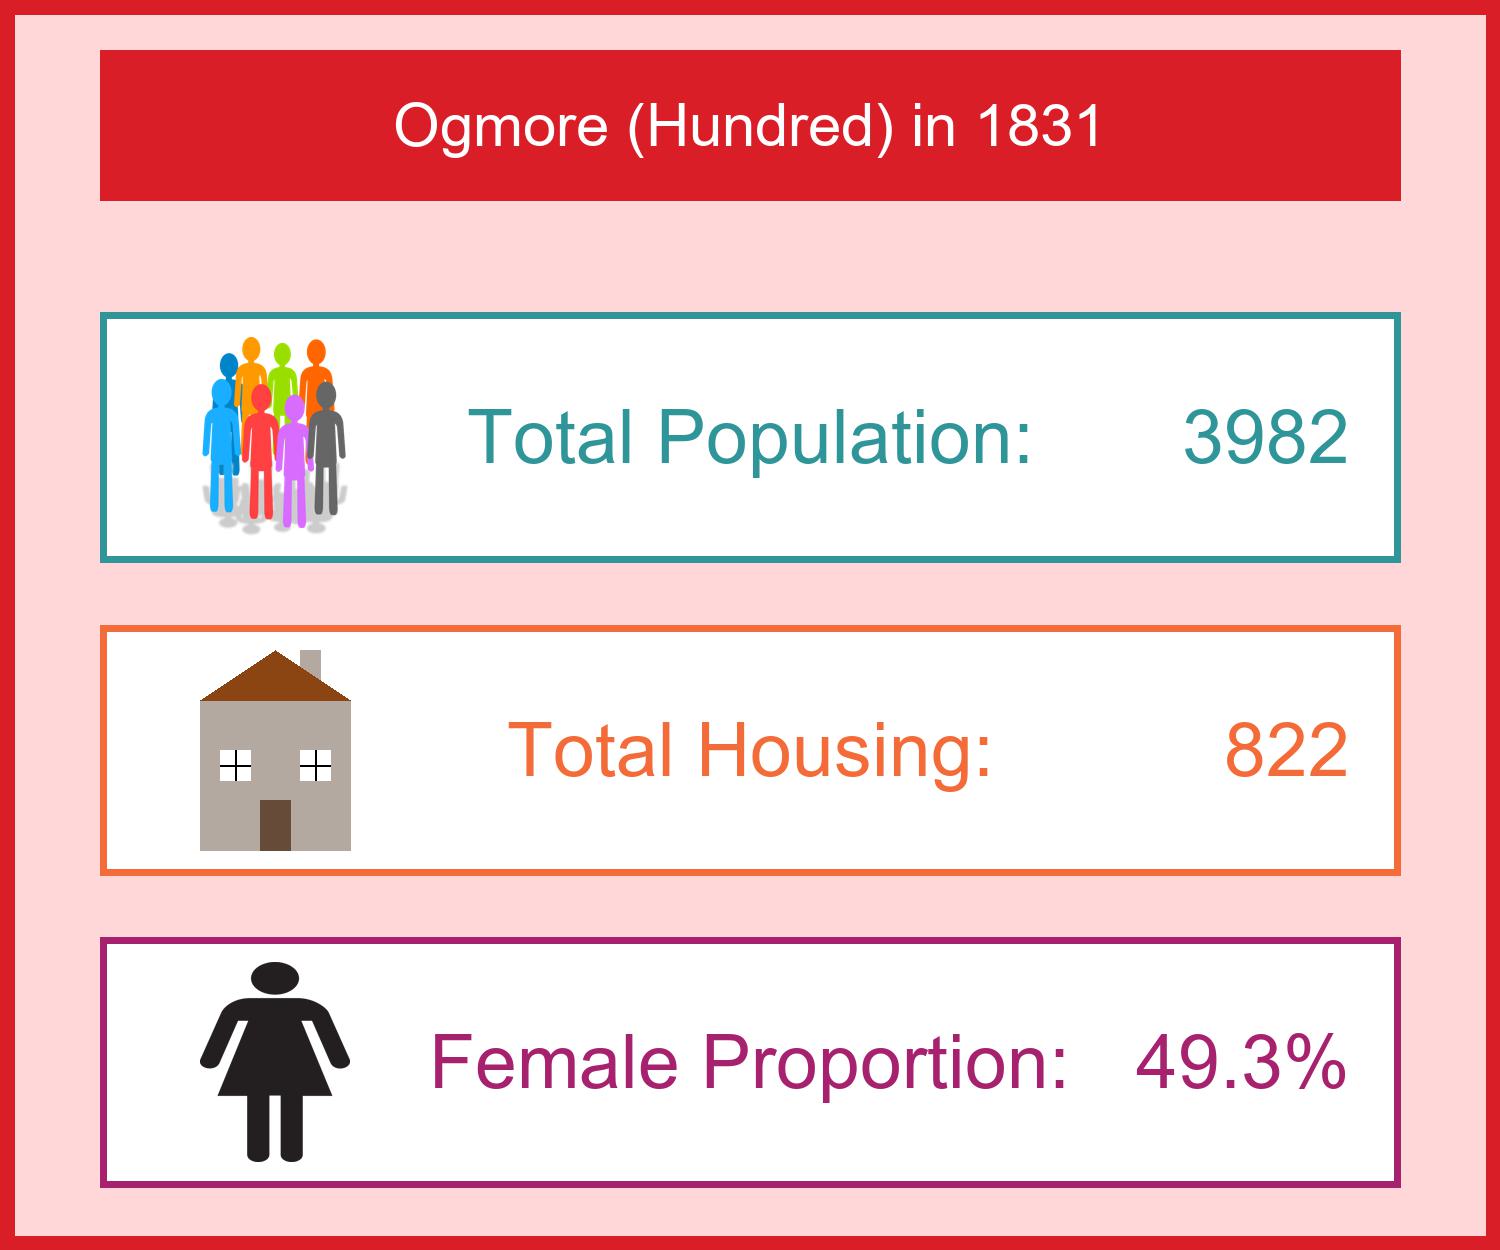
Below is a snapshot of key statistics which are population, number of houses, and the female proportion of the population.
Family Occupations
This pie chart shows the principle occupation by family in Ogmore. For Ogmore, the proportion of families that were mainly involved in Agriculture was 73.26%. In Manufacture and Trade, the proportion was 18.93%, and other occupations made up 7.81%.
For comparison, for the entire county of Glamorgan the proportion of families that were mainly involved in Agriculture was 26.1%. In Manufacture and Trade, the proportion was 34.2%, and other occupations made up 39.71%.
For comparison, for the entire country of Wales (including the county of Monmouth), the proportion of families that was mainly involved in Agriculture were 42.27%. In Manufacture and Trade, the proportion was 28.6%, and other occupations made up 29.13%.
Click on the graph to see the numbers in each area of employment.
Male Occupations
The bar chart shows a breakdown in occupations of males over 20 in the hundred of Ogmore. The following is a proportion breakdown of each employment type (with comparisons to county and country levels):
| Occupation | Ogmore | Glamorgan | Wales |
|---|---|---|---|
| Agriculture Employing Labourers | 12.78% | 5.73% | 9.65% |
| Agriculture Not Employing Labourers | 15.26% | 6.07% | 9.53% |
| Agriculture that are Labourers | 48.66% | 16.31% | 27.22% |
| Manufacturing | 0.41% | 6.26% | 4.29% |
| Retail Trade or Handicraft | 15.88% | 23.79% | 22.51% |
| Professional or other Education Occupation | 2.27% | 3.17% | 2.71% |
| Labourers not in Agriculture | 1.03% | 31.65% | 17.48% |
| Servants | 0.82% | 1.06% | 1.12% |
| Other Occupations | 2.89% | 5.96% | 5.5% |
Click on the graph to see the numbers in each type of employment.
Housing
This pie chart shows the houses in Ogmore by completion and whether they were inhabited. For Ogmore, the proportion of houses that were inhabited was 95.62%. For houses being built, the proportion was 0.24%, and uninhabited made up 4.14%.
For comparison, for the entire county of Glamorgan, the proportion of houses that were inhabited was 93.82%. For houses being built, the proportion was 1.07%, and uninhabited made up 5.11%.
For comparison, for the entire country of Wales (including the county of Monmouth), the proportion of houses that were inhabited was 95.35%. For houses being built, the proportion was 0.8%, and uninhabited made up 3.84%.
Click on the graph to see the numbers in each type of housing.