Nant-Conway
Nant-Conway is a historic hundred in the county of Carnarvon. It was number 9 out of 10 (in population) in the county of Carnarvon and number 84 out of 90 in all of Wales.
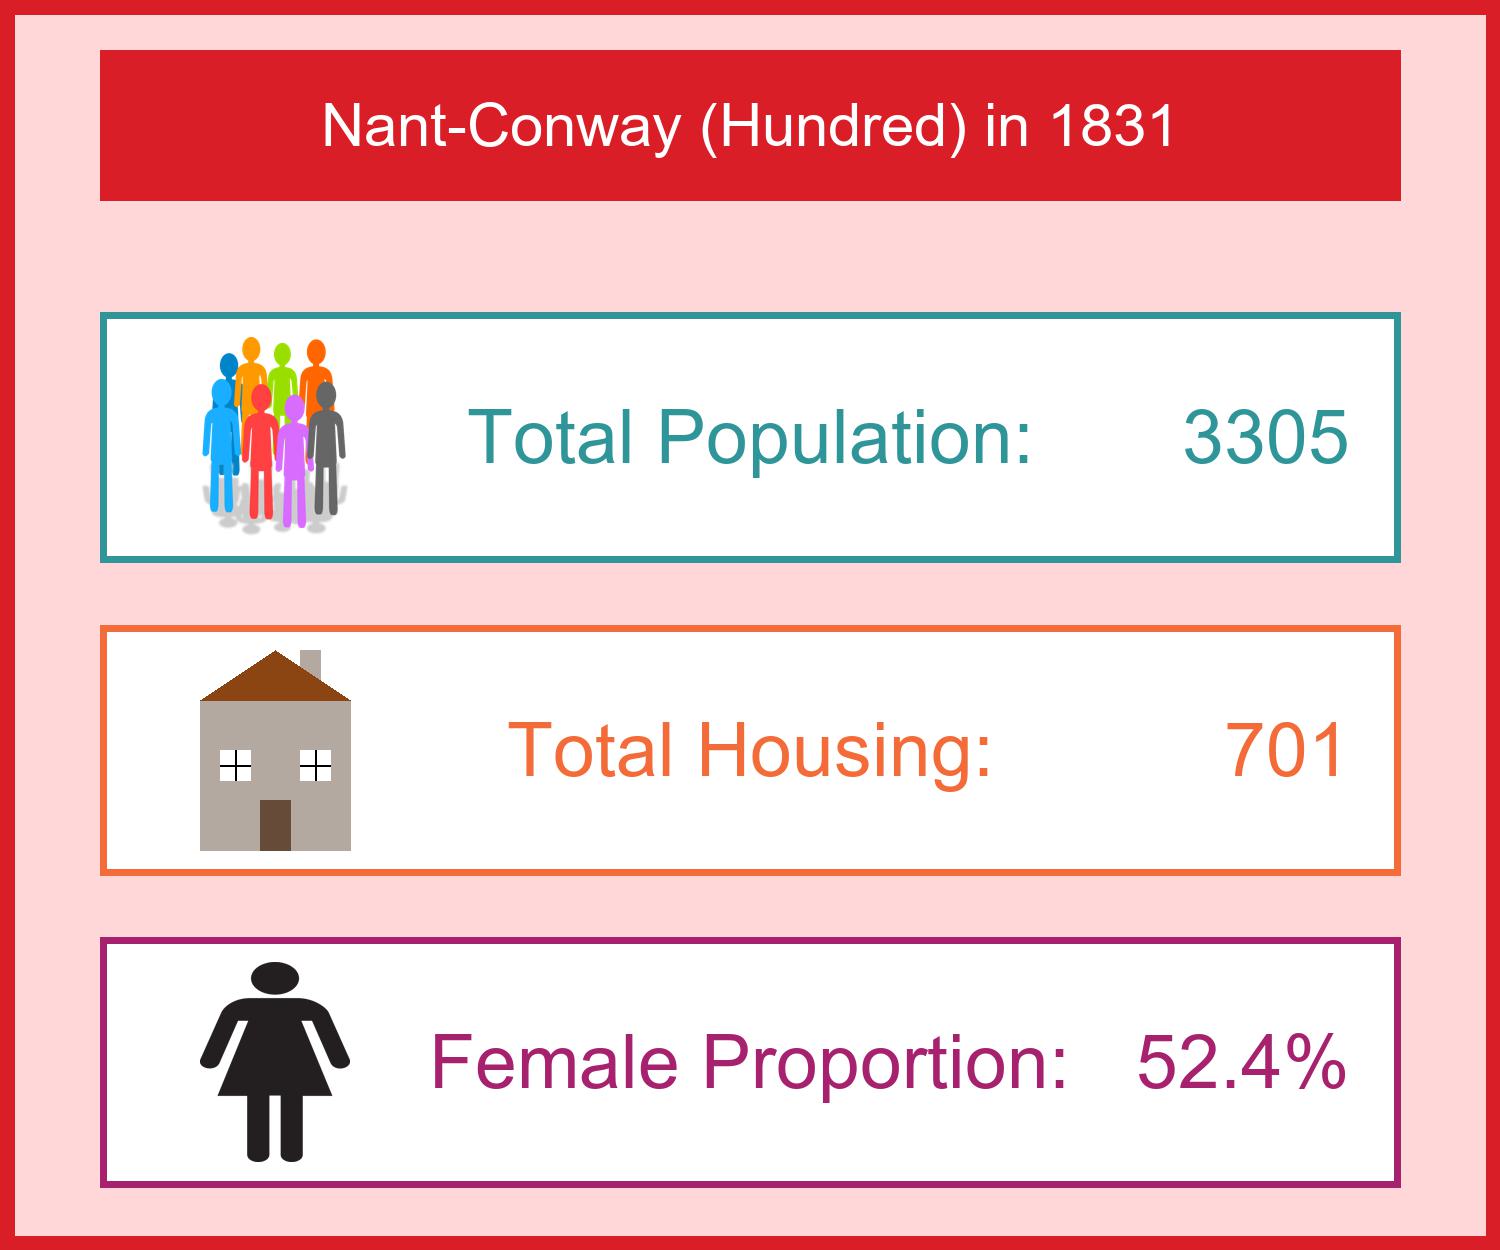
Basic Statistics
Below is a snapshot of key statistics which are population, number of houses, and the female proportion of the population.
Family Occupations
This pie chart shows the principle occupation by family in Nant-Conway. For Nant-Conway, the proportion of families that were mainly involved in Agriculture was 54.65%. In Manufacture and Trade, the proportion was 10.03%, and other occupations made up 35.32%.
For comparison, for the entire county of Carnarvon the proportion of families that were mainly involved in Agriculture was 39.7%. In Manufacture and Trade, the proportion was 20.59%, and other occupations made up 39.7%.
For comparison, for the entire country of Wales (including the county of Monmouth), the proportion of families that was mainly involved in Agriculture were 42.27%. In Manufacture and Trade, the proportion was 28.6%, and other occupations made up 29.13%.
Click on the graph to see the numbers in each area of employment.
Male Occupations
The bar chart shows a breakdown in occupations of males over 20 in the hundred of Nant-Conway. The following is a proportion breakdown of each employment type (with comparisons to county and country levels):
| Occupation | Nant-Conway | Carnarvon | Wales |
|---|---|---|---|
| Agriculture Employing Labourers | 10.27% | 9.01% | 9.65% |
| Agriculture Not Employing Labourers | 25.23% | 13.39% | 9.53% |
| Agriculture that are Labourers | 24.32% | 26.09% | 27.22% |
| Manufacturing | 0.26% | 0.86% | 4.29% |
| Retail Trade or Handicraft | 2.73% | 19.36% | 22.51% |
| Professional or other Education Occupation | 0.13% | 1.99% | 2.71% |
| Labourers not in Agriculture | 13.65% | 21.07% | 17.48% |
| Servants | 0.0% | 0.65% | 1.12% |
| Other Occupations | 23.41% | 7.58% | 5.5% |
Click on the graph to see the numbers in each type of employment.
Housing
This pie chart shows the houses in Nant-Conway by completion and whether they were inhabited. For Nant-Conway, the proportion of houses that were inhabited was 95.86%. For houses being built, the proportion was 0.14%, and uninhabited made up 3.99%.
For comparison, for the entire county of Carnarvon, the proportion of houses that were inhabited was 95.99%. For houses being built, the proportion was 0.86%, and uninhabited made up 3.15%.
For comparison, for the entire country of Wales (including the county of Monmouth), the proportion of houses that were inhabited was 95.35%. For houses being built, the proportion was 0.8%, and uninhabited made up 3.84%.
Click on the graph to see the numbers in each type of housing.