Kelly
Kelly was the number 2 surname in Ireland in 1911. This includes possible variations Kelly, MacKelly, McKelly and O'Kelly.
1. Proportion of Population by District
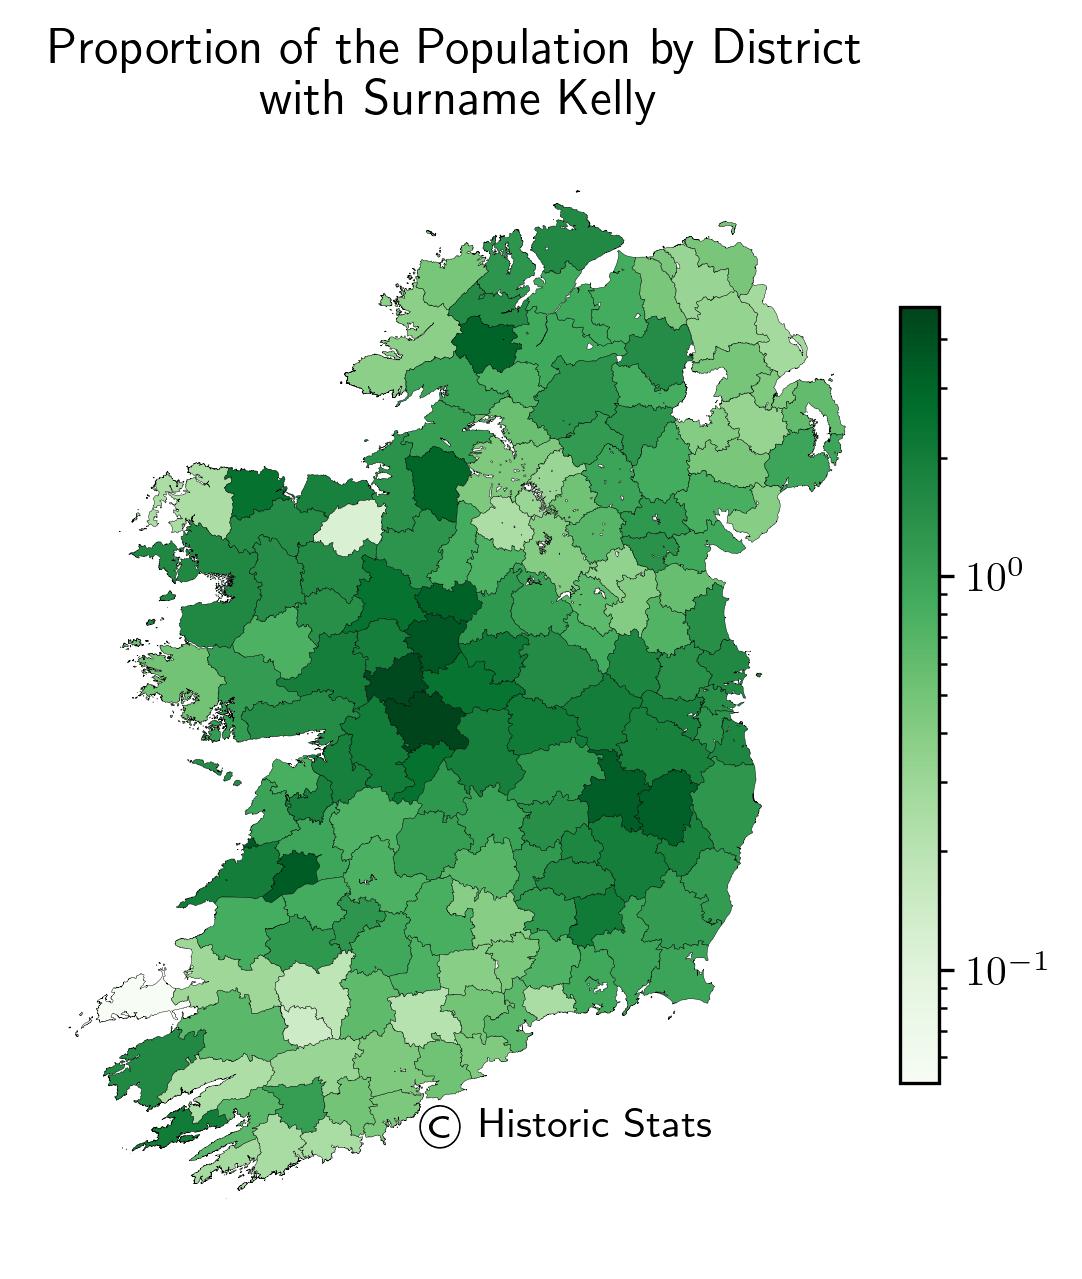
The map here shows the proportion of the population with surname Kelly by district which were also known as the Poor Law Unions. The districts with the highest proportion were Ballinasloe at 4.84%, Mountbellow at 4.52%, and Roscommon at 3.69%. The proportions shown use scientific notation where the colour map uses a log norm which is discussed in the methodology section which can be viewed using the link above.
2. Proportion of Population by DED
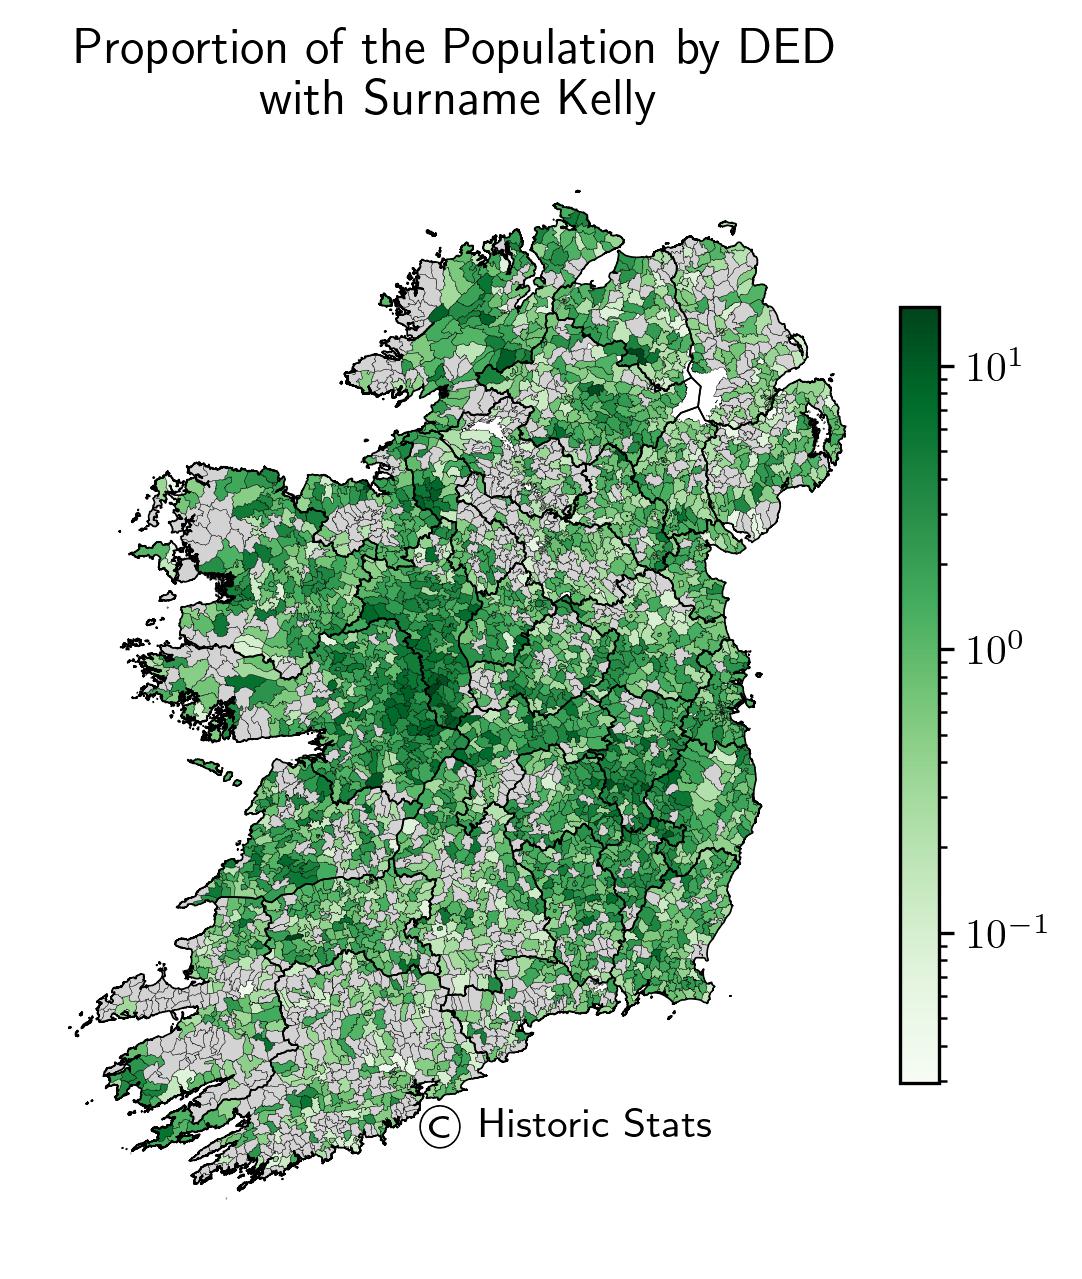
The map here shows the proportion of the population with surname Kelly by DED. The electoral divisions with the highest proportion were Garryduff in County Limerick at 16.17%, Dysart in County Roscommon at 16.09%, and Bancran Glebe in County Londonderry at 15.61%. The proportions shown use scientific notation where the colour map uses a log norm which is discussed in the methodology section which can be viewed using the link above.
3. Marital Status
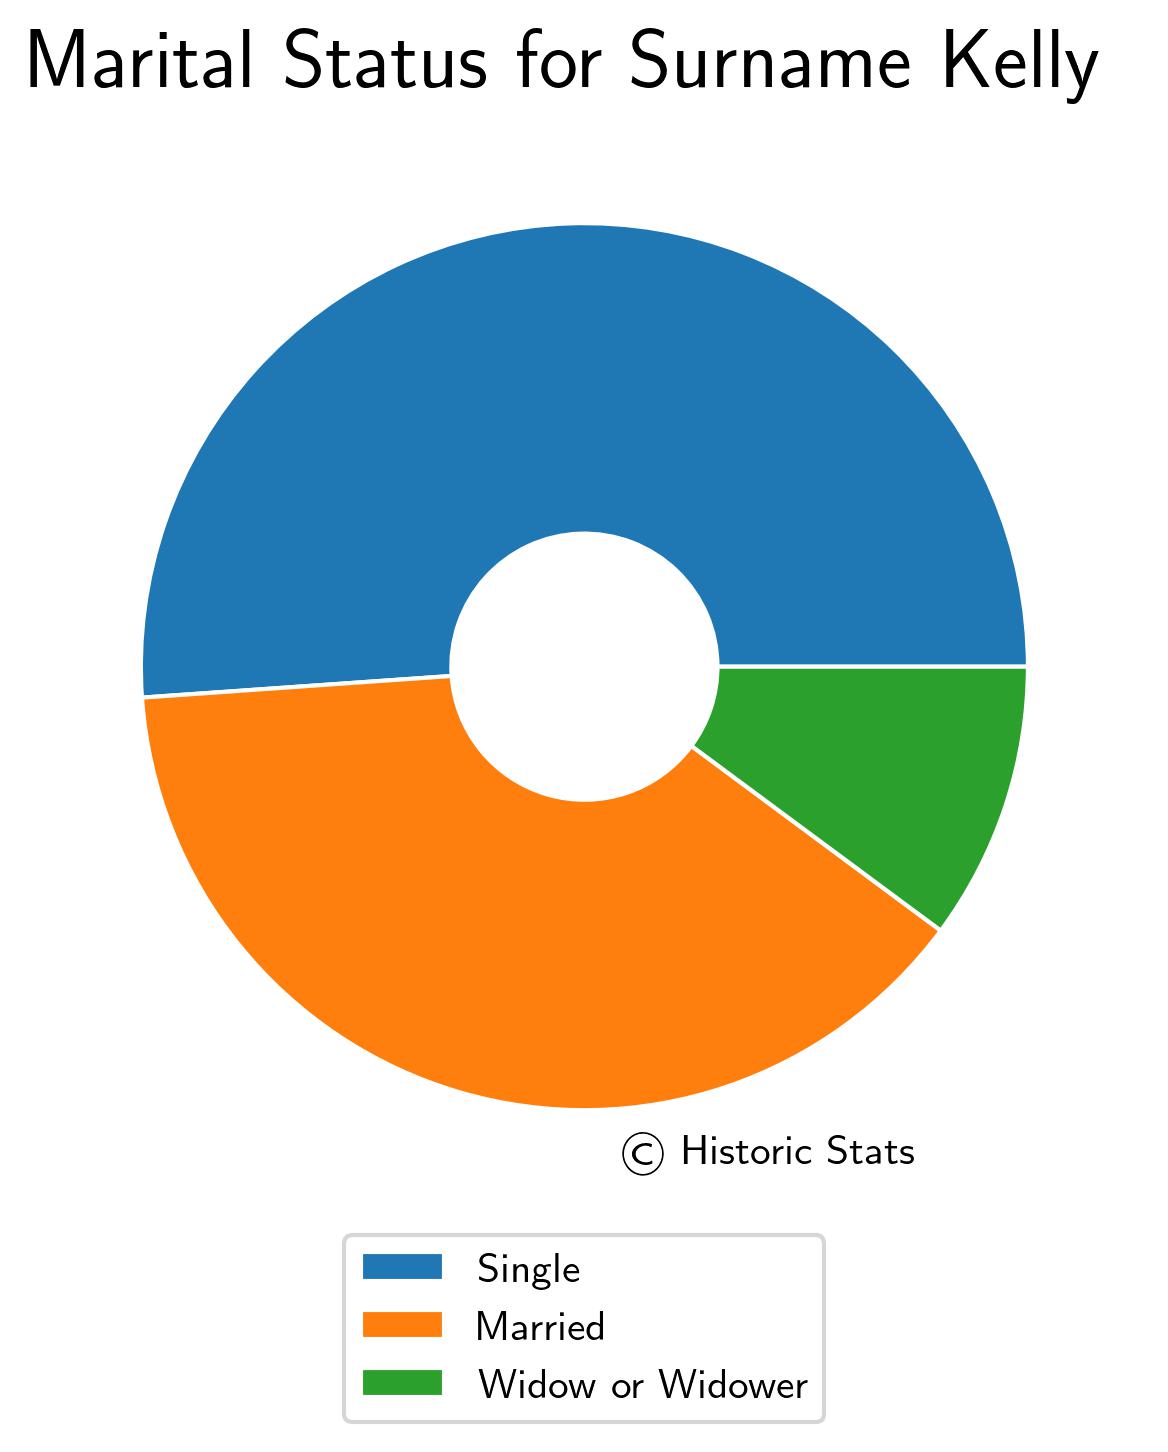
The pie chart shows the marital status of the population with surname Kelly. This is either single, married, or widow or widower. The proportion of responses aged over 15 who were single were 51.11%, married were 38.74%, and either widowed or widow were 10.15%.
4. Most Common Forenames
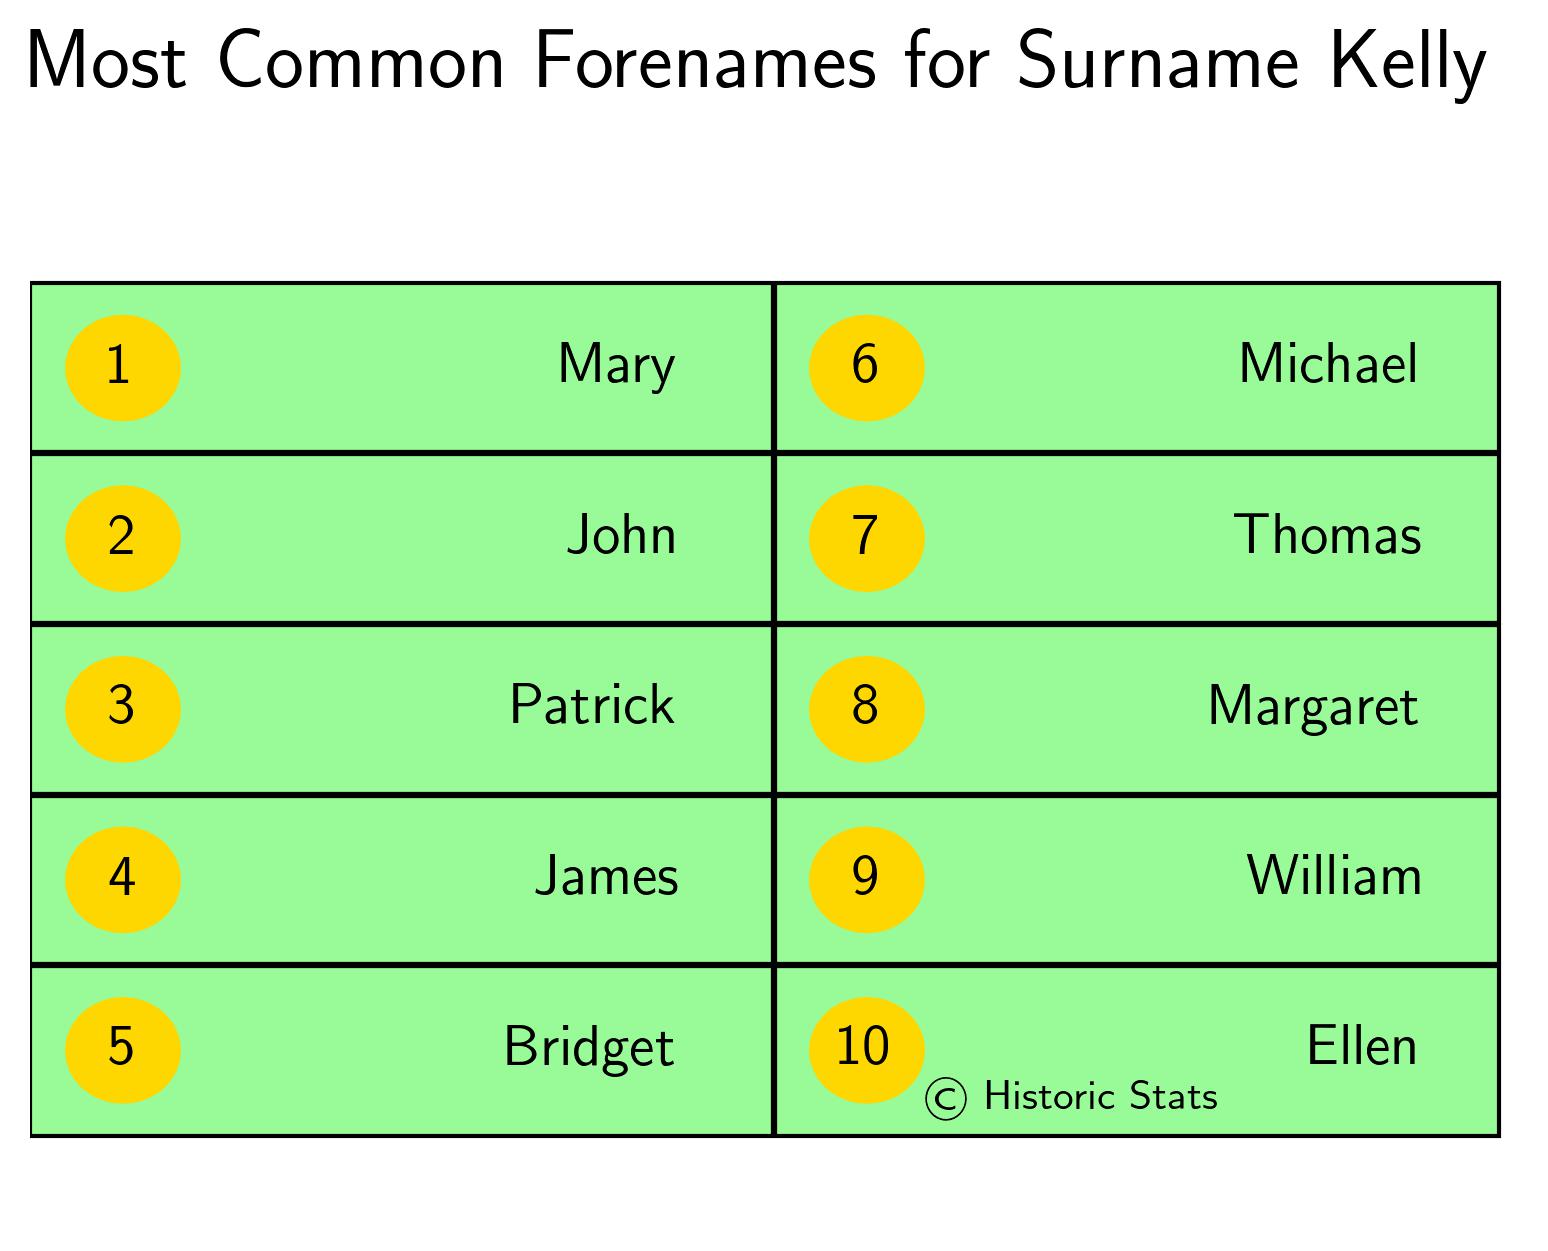
The table shown here displays the top 10 first names by the number of people who had the surname Kelly. The most common first name was Mary at 4244 people, followed by John at 3741 people, Patrick at 2995 people, and James at 2359 people.
5. Population Pyramid
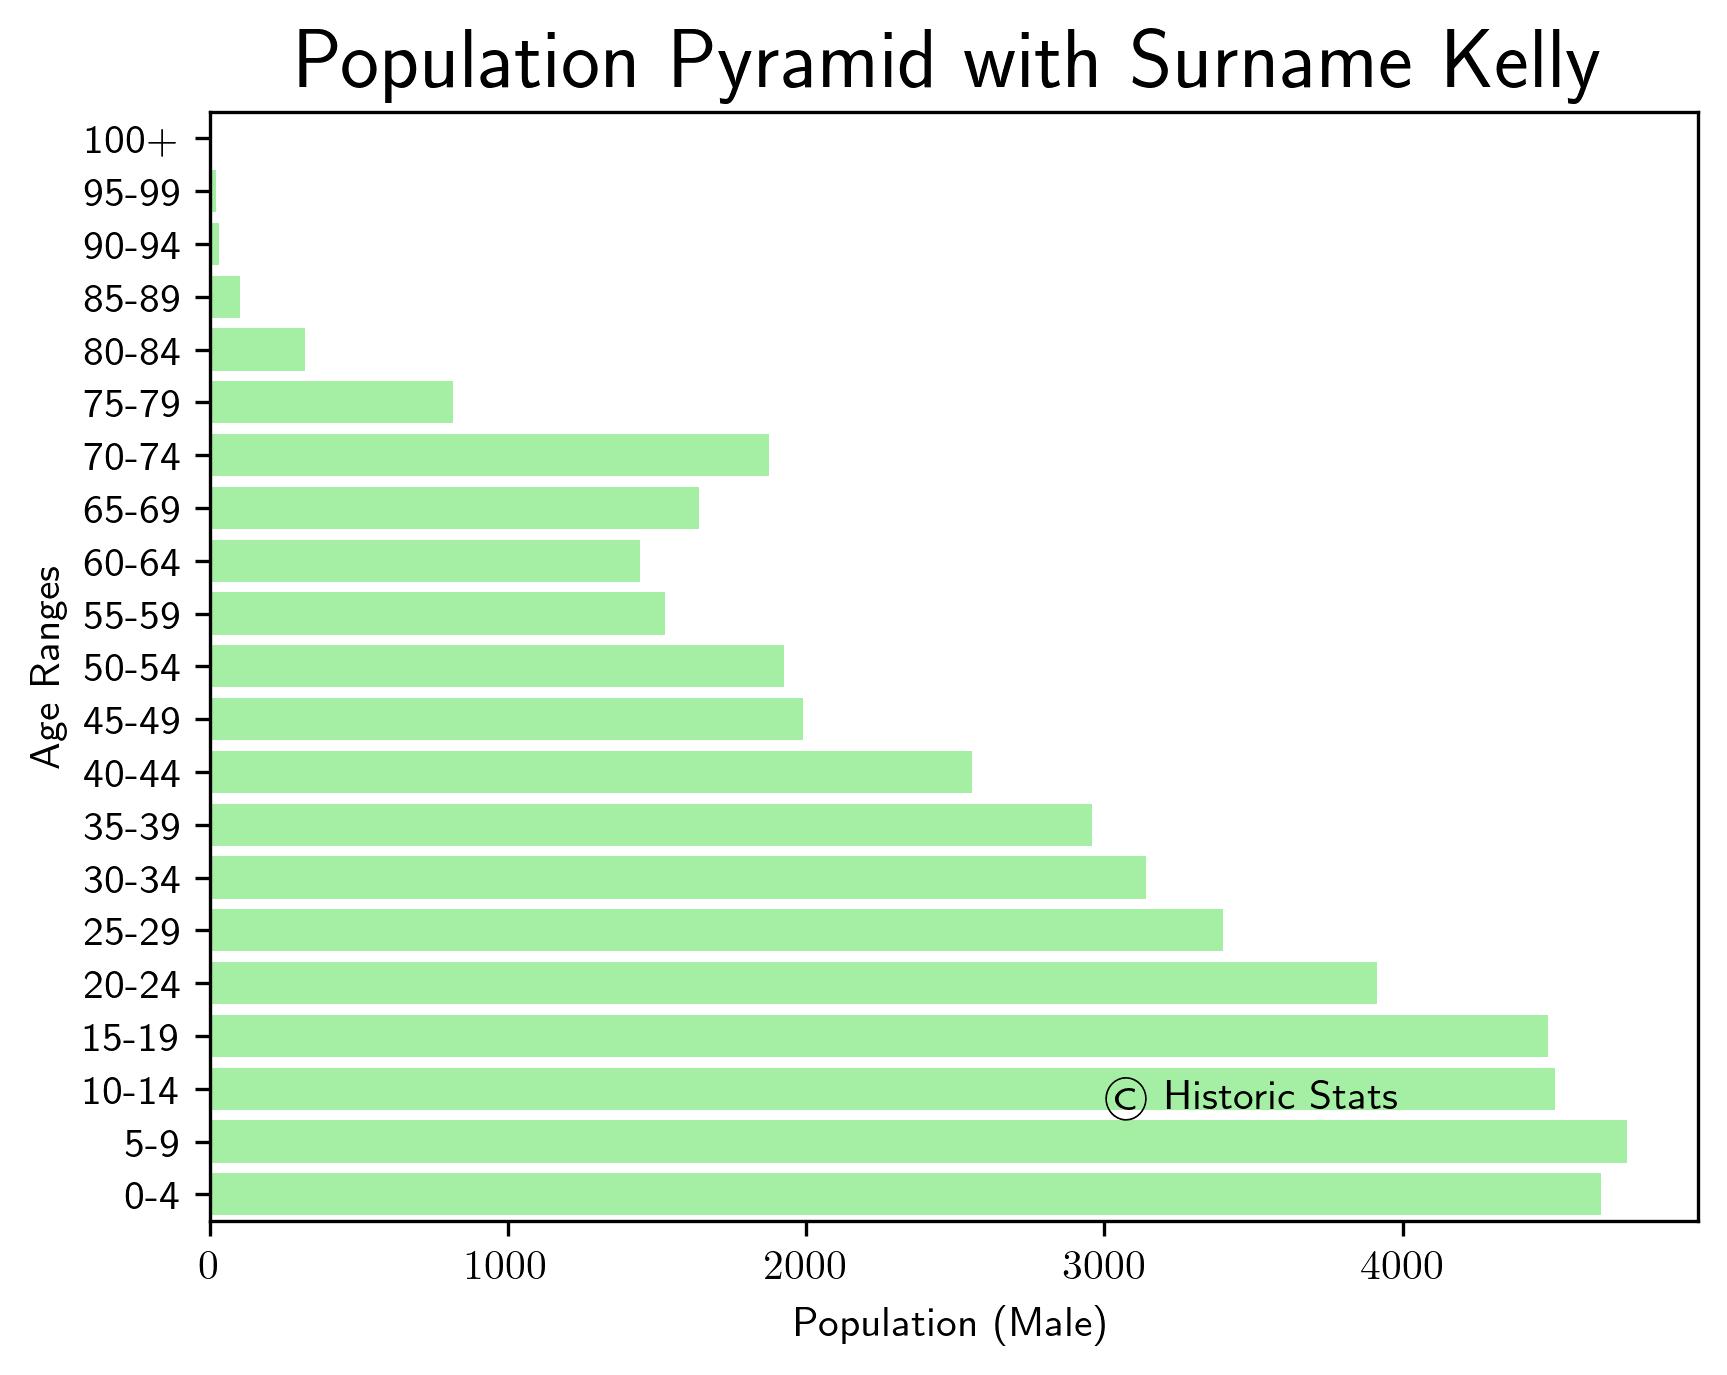
The population pyramid displays a breakdown in groups of every 5 years the number of people with the surname Kelly.
6. Religious Breakdown
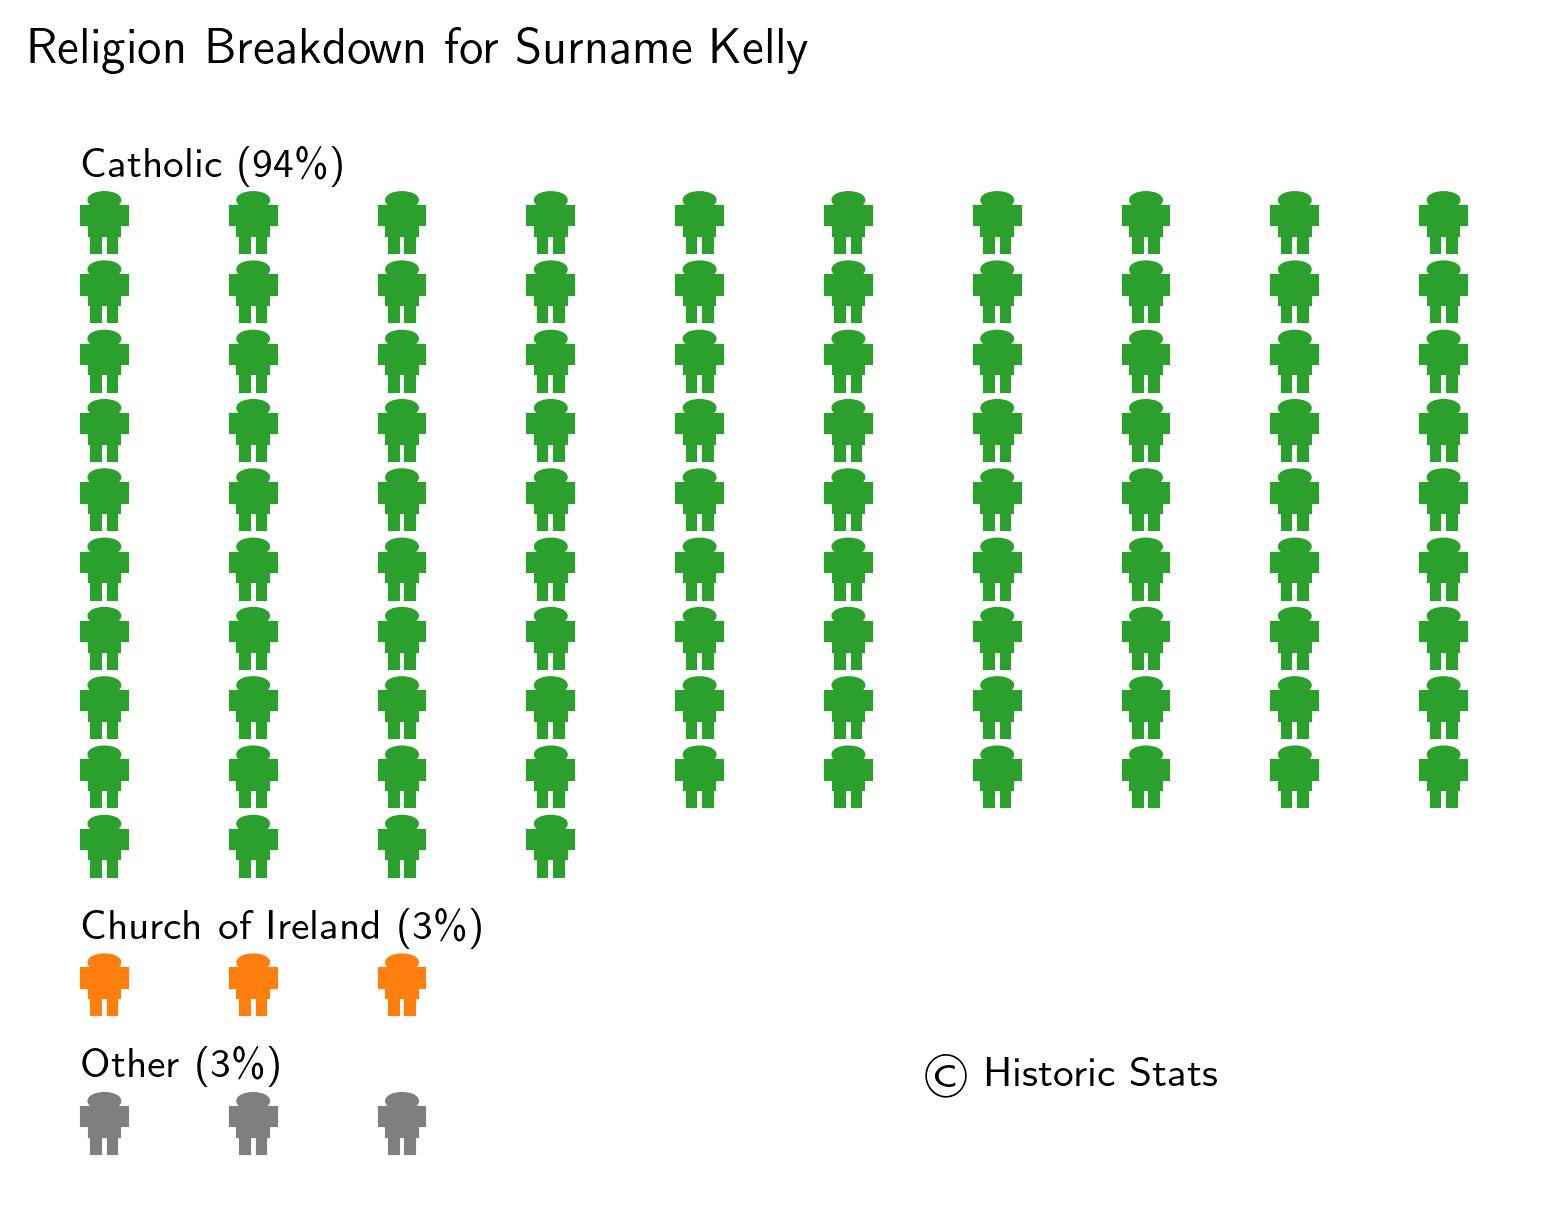
The image shown is the religious breakdown for the population with surname Kelly. Each religion has been rounded to the nearest whole percentage and any religion less than 3% has been classified as other. The most common religion was Catholic at 94.0%.
7. Occupations
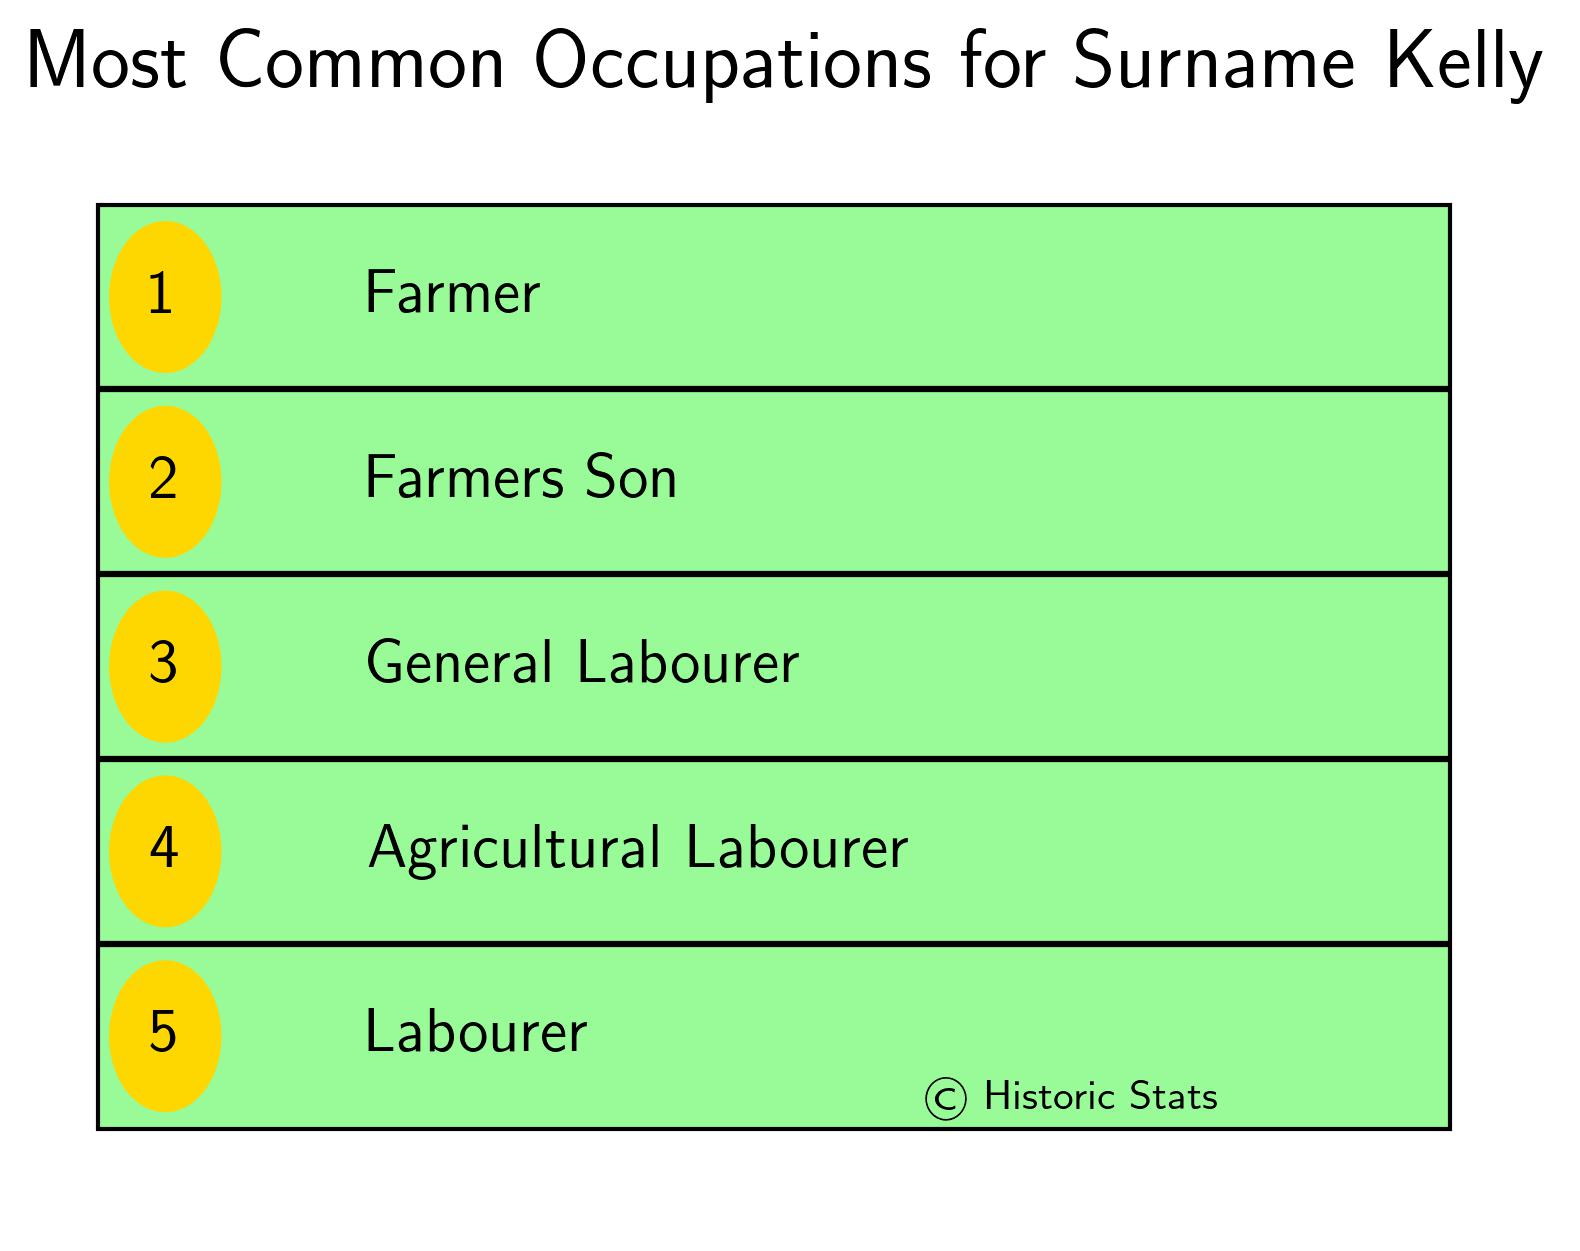
The table shown were the top 5 occupations for the population with the surname Kelly. The most common occupation was Farmer at 4443 people, followed by Farmers Son at 1851 people, and General Labourer at 980 people.
8. Birthplace by County
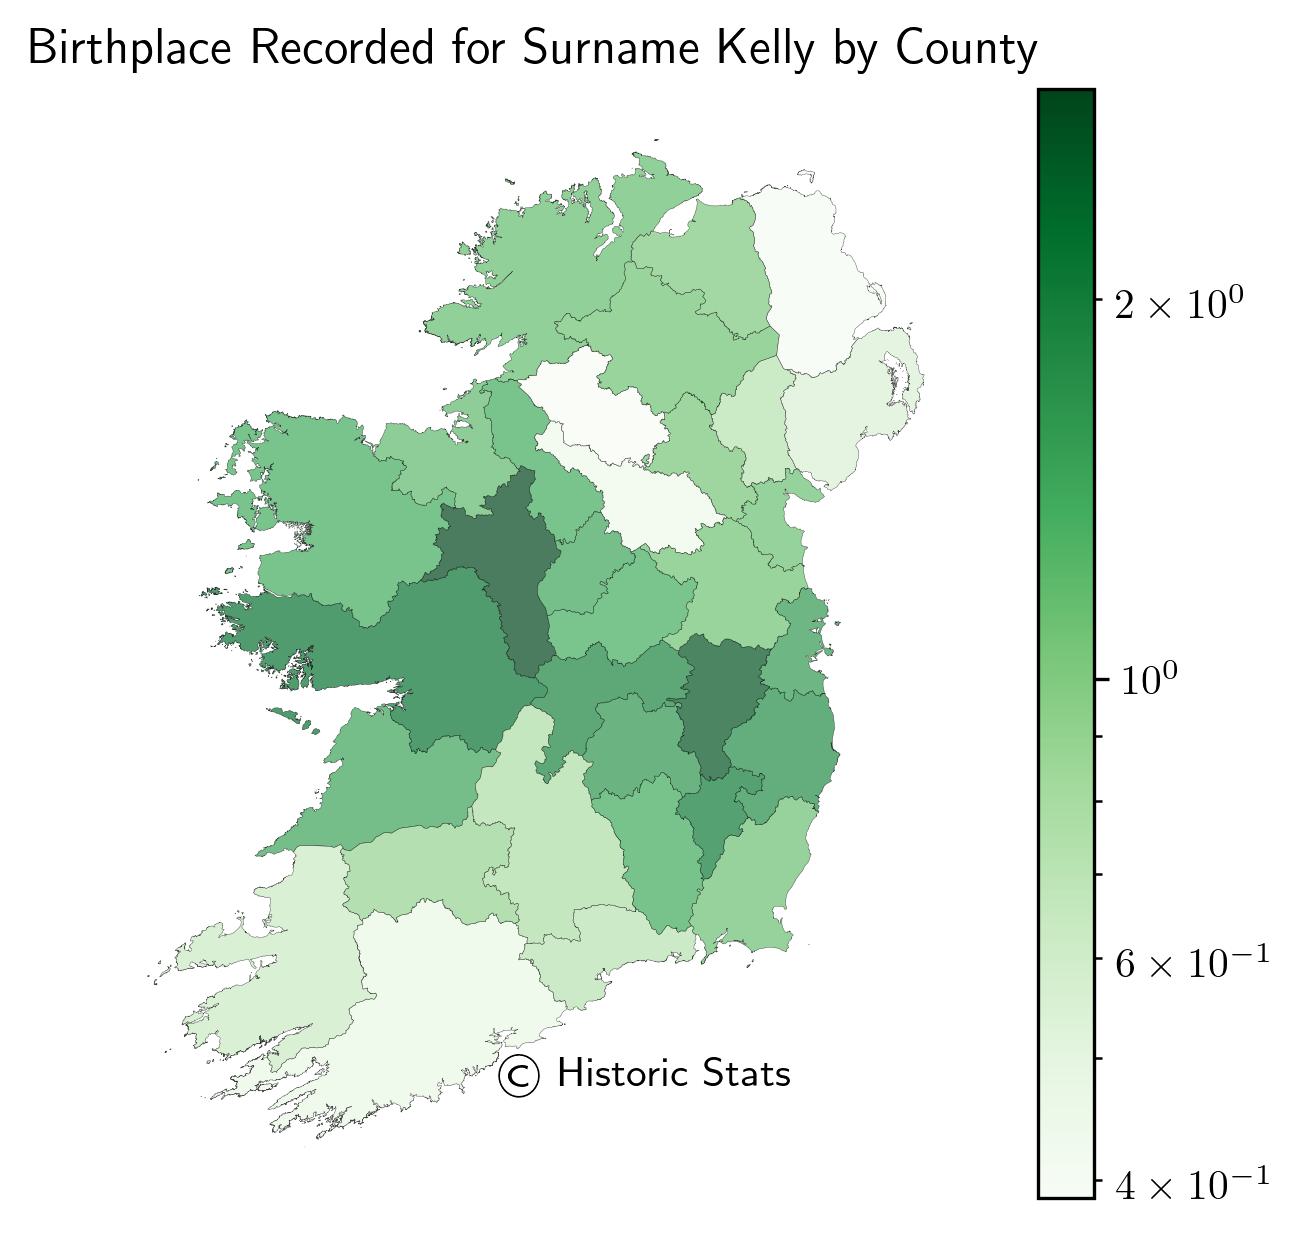
The map shown here was the proportion of the population with surname Kelly who were born in each of the counties in Ireland. Unlike the proportion of the population above, this is the reported birthplace on the census. The counties with the highest proportion from it were Roscommon at 2.94%, followed by Kildare at 2.71%, Galway at 2.16%, and Carlow at 2.05%. The proportions shown use scientific notation where the colour map uses a log norm which is discussed in the methodology section which can be viewed using the link above.
9. Literacy
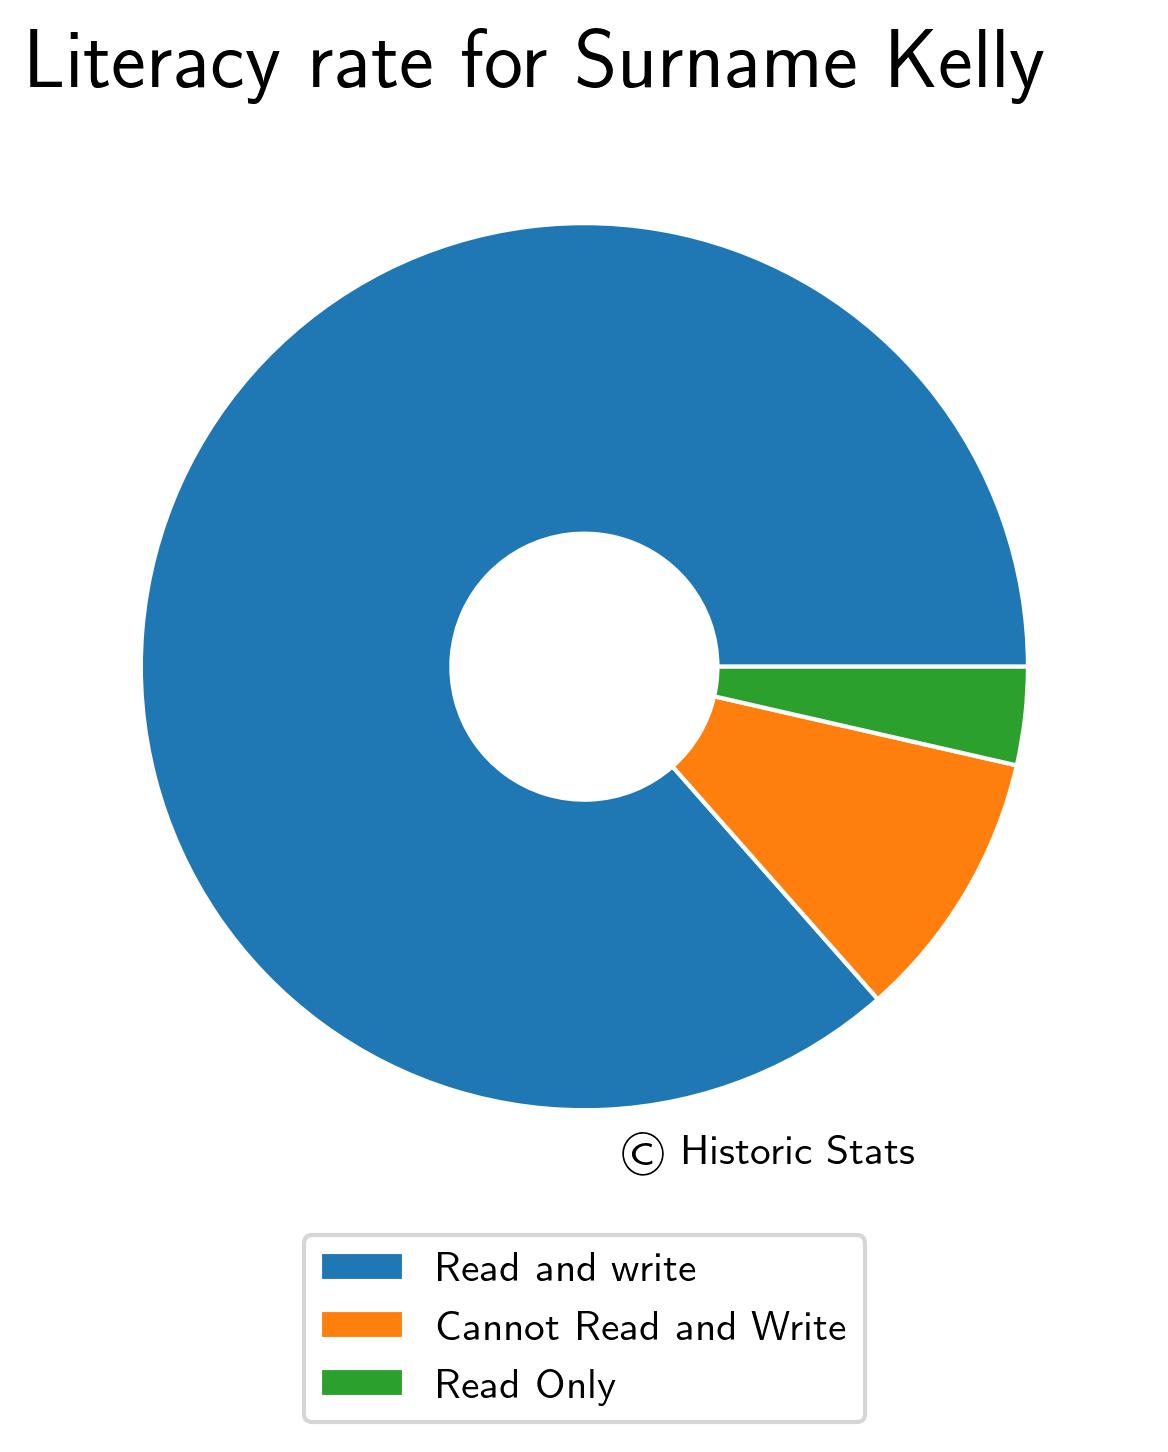
For the literacy pie chart shown, there are three categories, one for those who could read and write, another for those who could read only and the final for those who could not read or write. The pie chart is based on the population with surname Kelly. The proportion of responses aged over 9 who can read and write were 86.51%, read only were 3.57%, and not able to read or write were 9.92%.
10. Irish Language
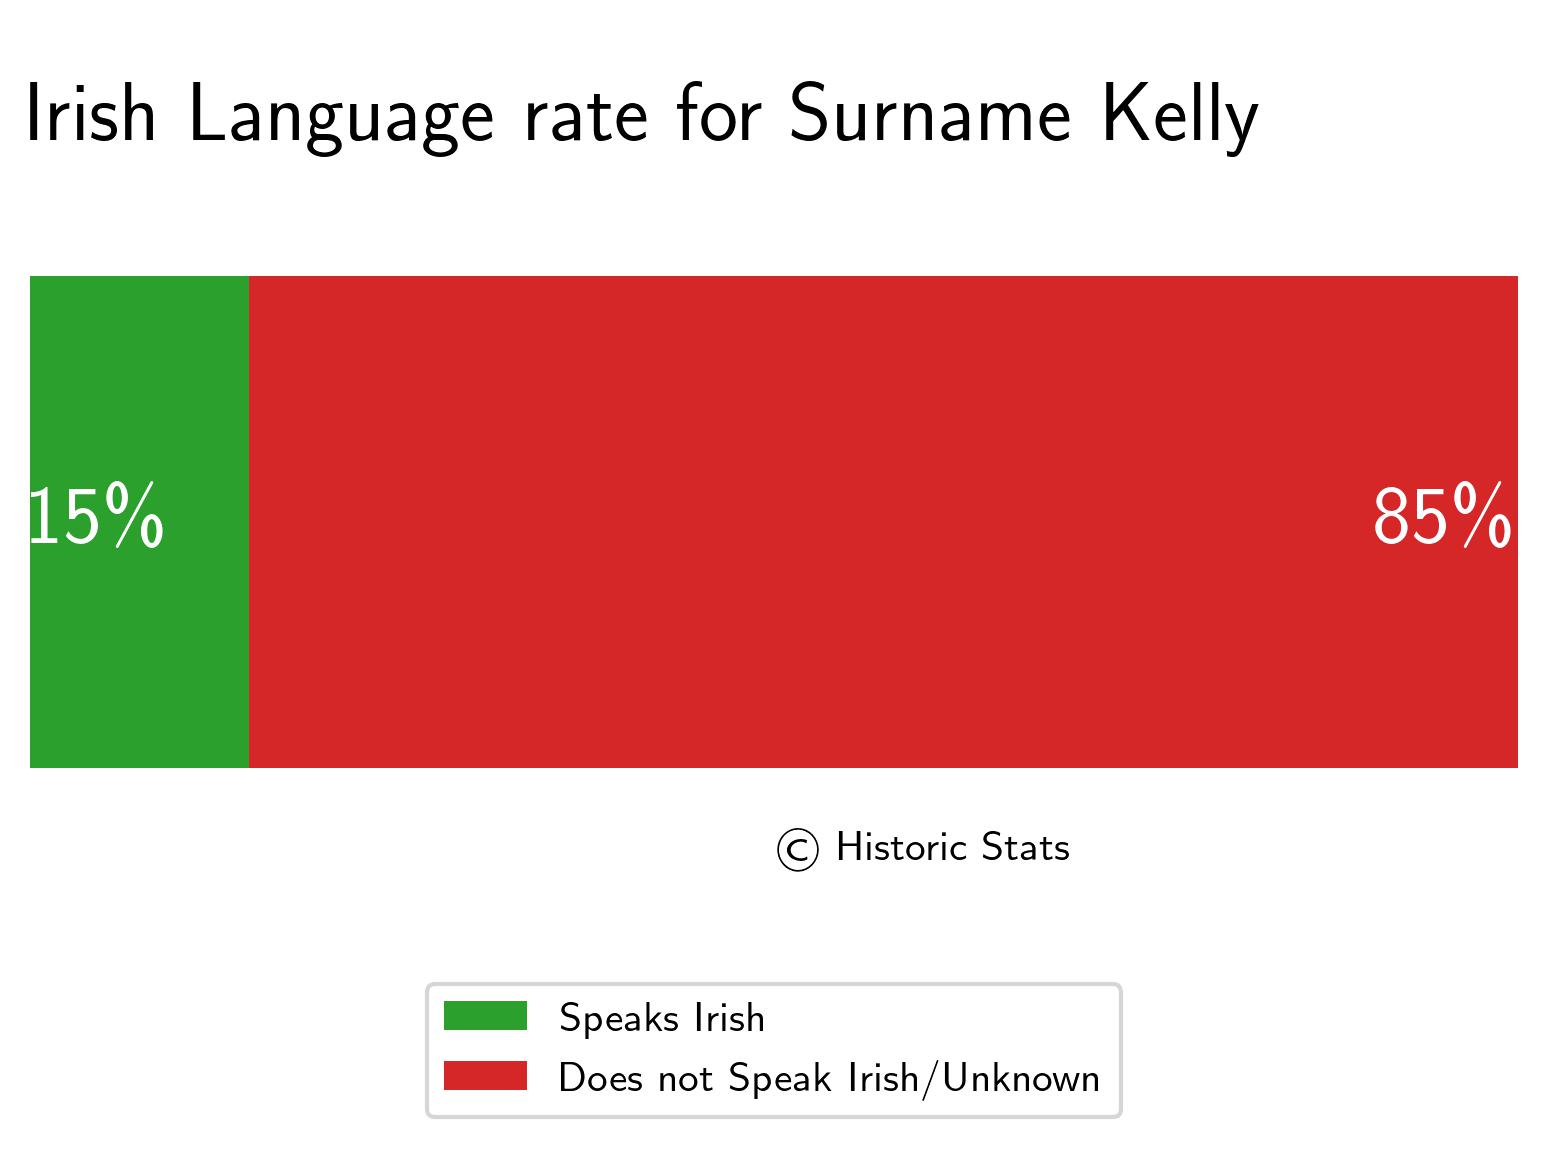
The bar shown here is the percentage (in green) who could speak Irish while the percentage in red were those who do not speak Irish or if the census entry was blank or unknown for the population with surname Kelly. The proportion who could speak Irish was 15.0%, while either not speaking Irish or unknown was 85.0%.