James
James was the number 2 male firstname in Ireland in 1911
1. Proportion of Population by District
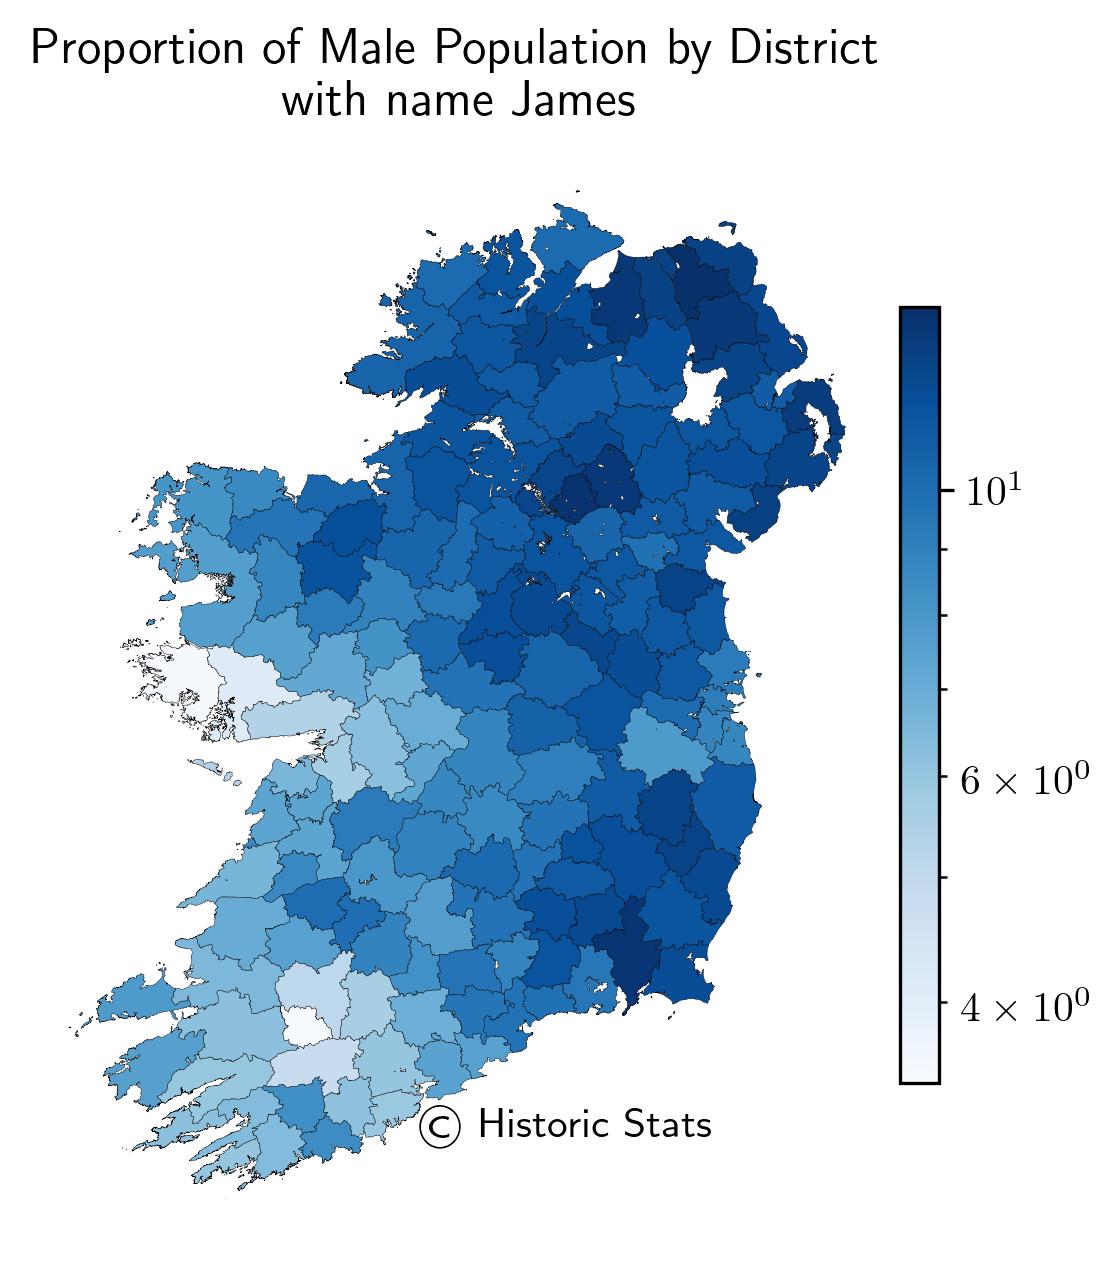
The map here shows the proportion of the male population with name James by district which were also known as the Poor Law Unions. The districts with the highest proportion were Ballymoney at 13.88%, Clones at 13.61%, and New Ross at 13.37%. The proportions shown use scientific notation where the colour map uses a log norm which is discussed in the methodology section which can be viewed using the link above.
2. Proportion of Population by DED
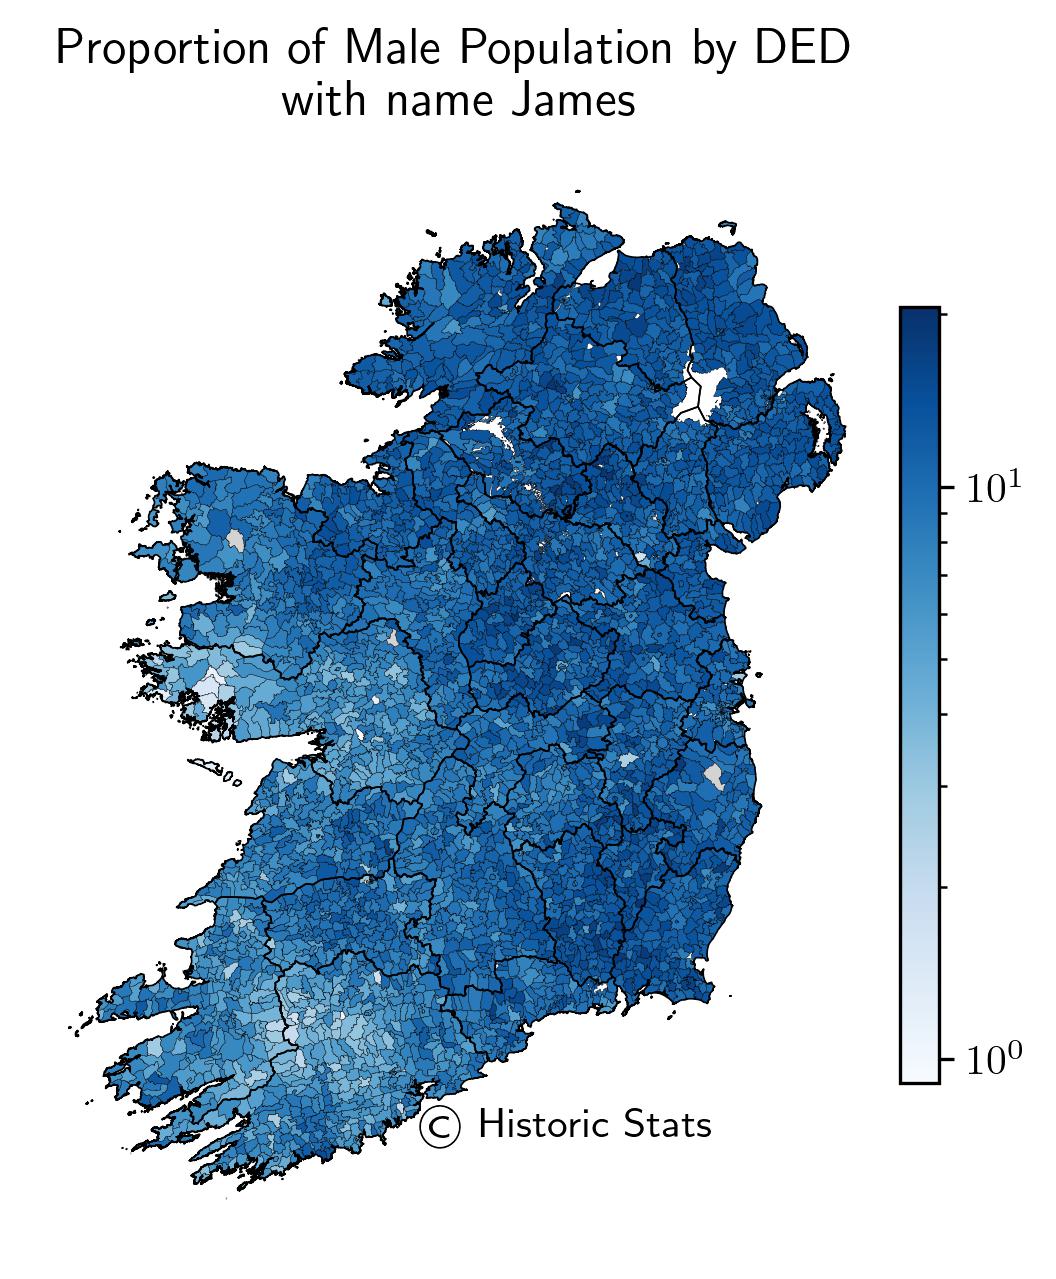
The map here shows the proportion of the male population with name James by DED. The electoral divisions with the highest proportion were Moatfarrell in County Longford at 20.65%, Lisnacreaght in County Tyrone at 19.15%, and Coonogue in County Carlow at 19.05%. The proportions shown use scientific notation where the colour map uses a log norm which is discussed in the methodology section which can be viewed using the link above.
3. Marital Status
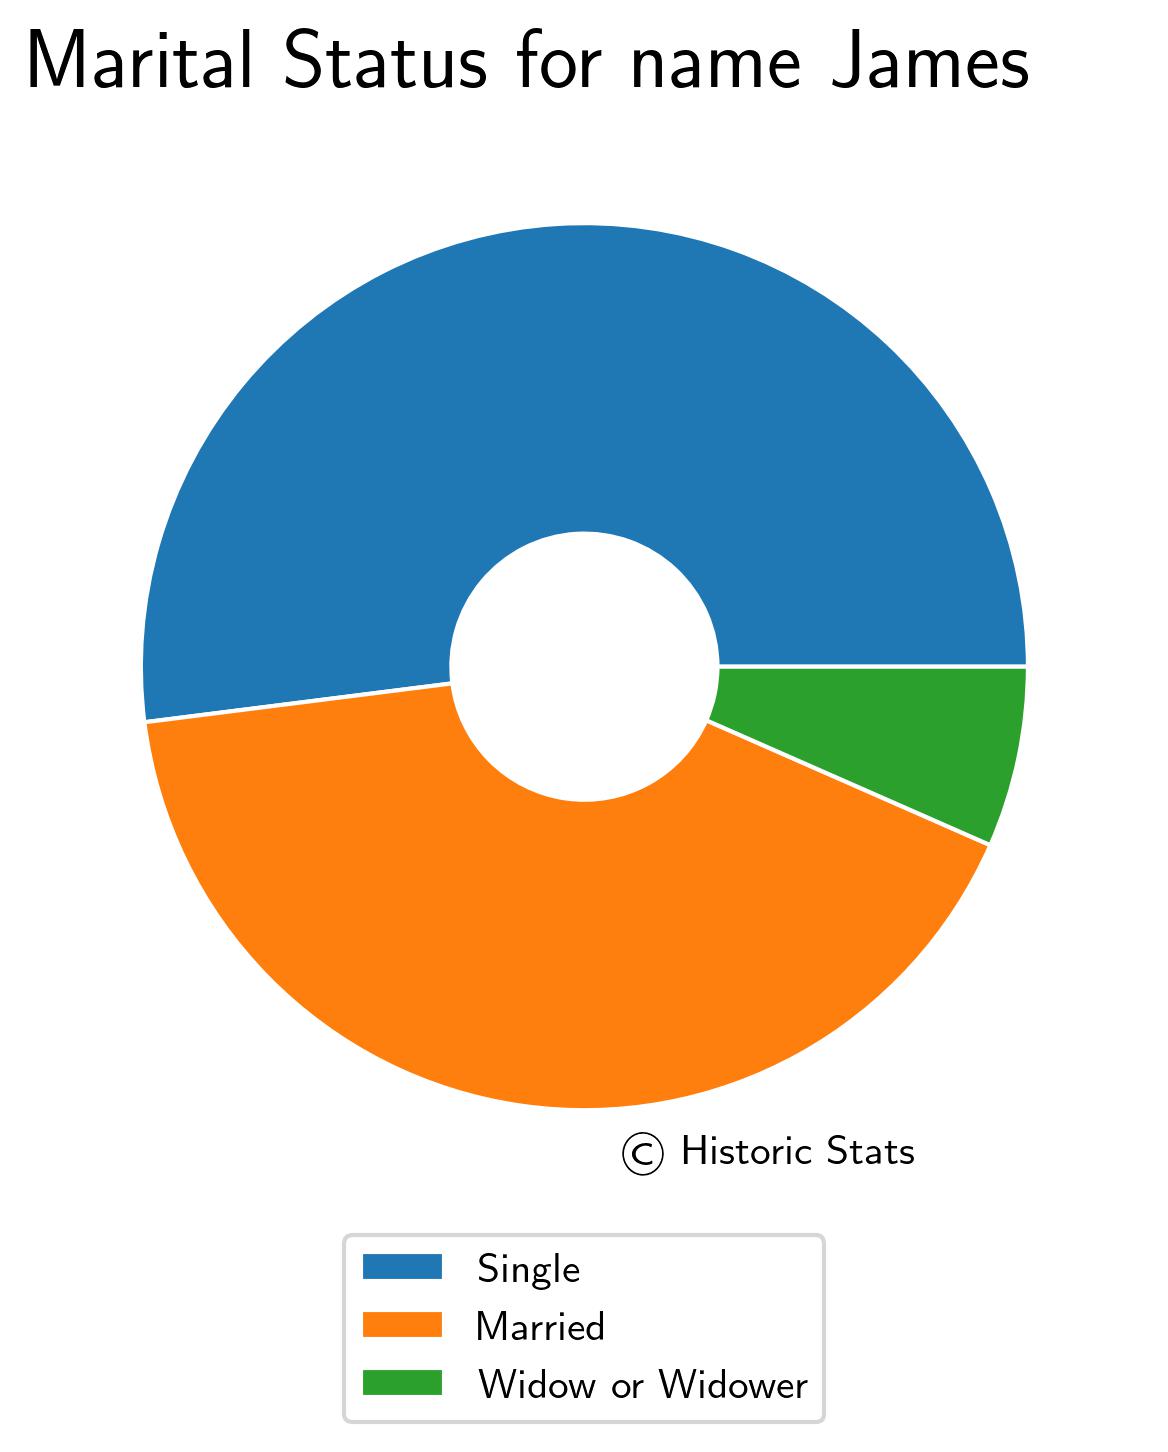
The pie chart shows the marital status of the male population named James. This is either single, married, or widow or widower. The proportion of responses aged over 15 who were single were 52.0%, married were 41.41%, and either widowed or widow were 6.59%.
4. Most Common Forenames
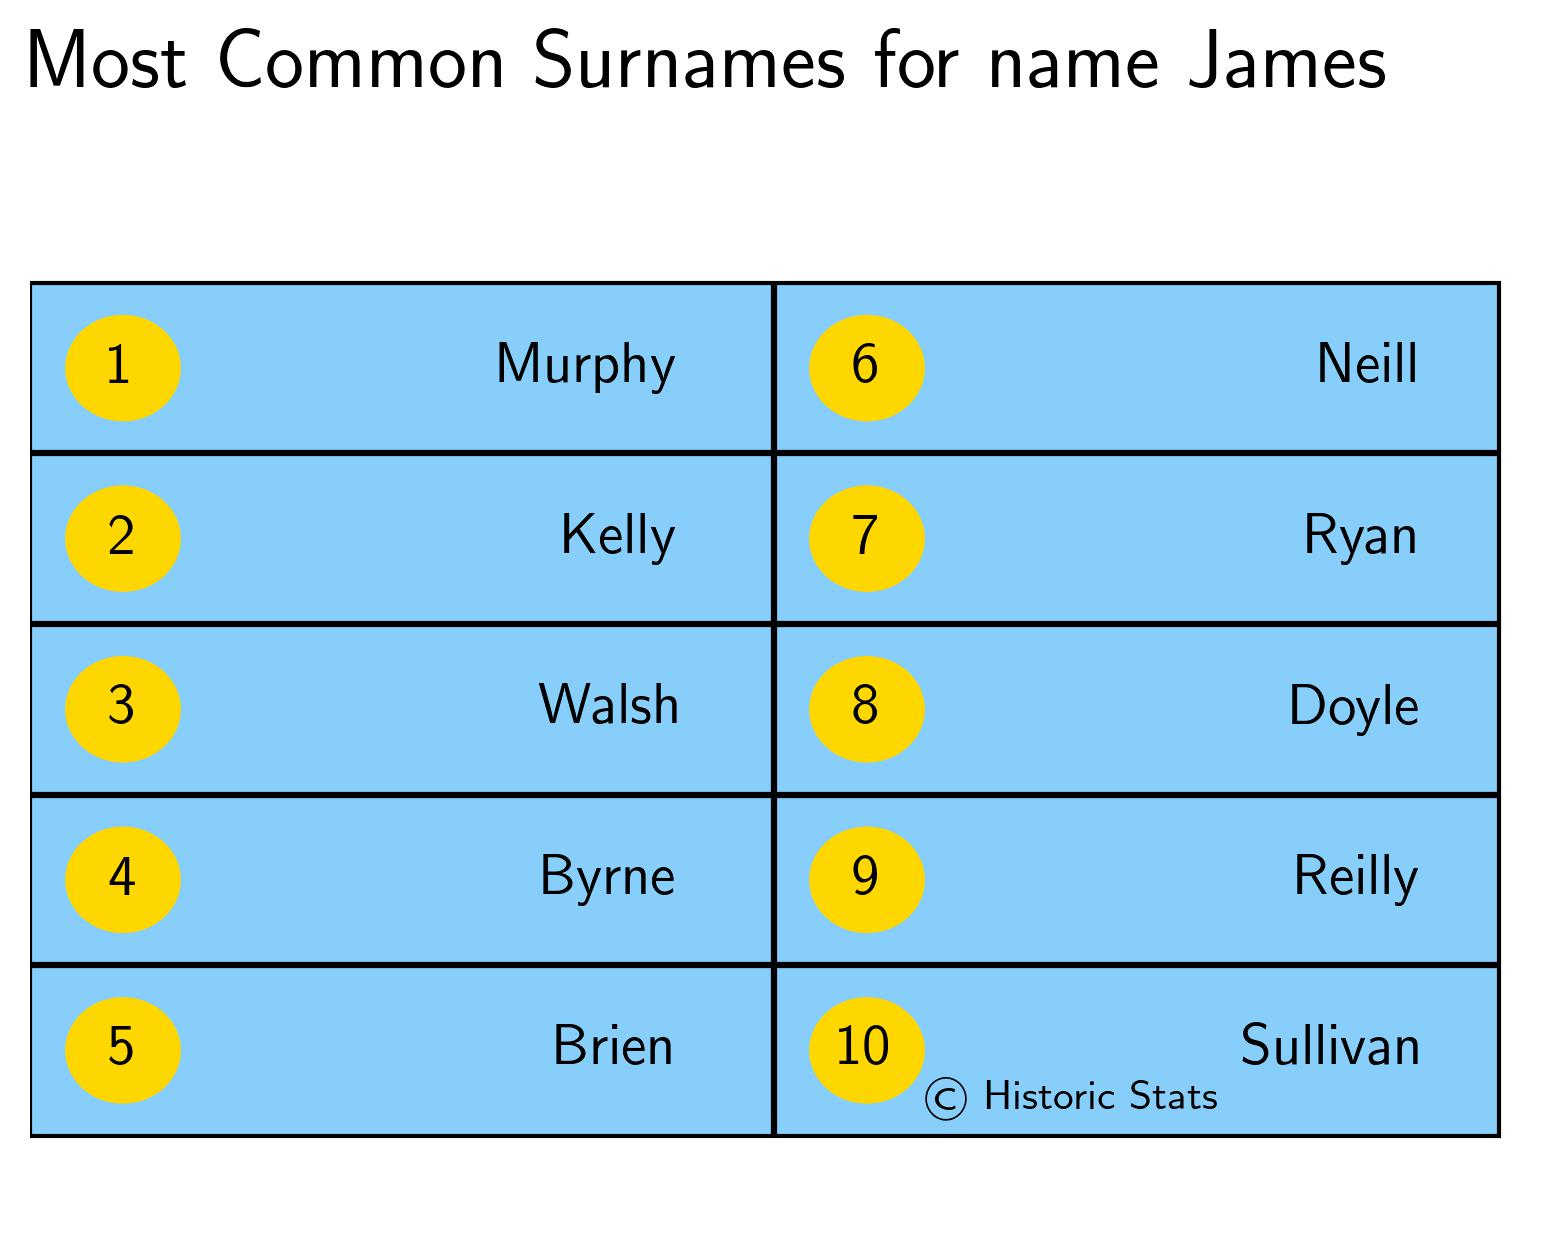
The table shown here displays the top 10 surnames by the number of males who had the name James. These surnames are grouped regardless of common prefixes such as "O", "Mac" and "Mc". The most common surname was Murphy at 2562 people, followed by Kelly at 2355 people, Walsh at 1743 people, and Byrne at 1665 people.
5. Population Pyramid
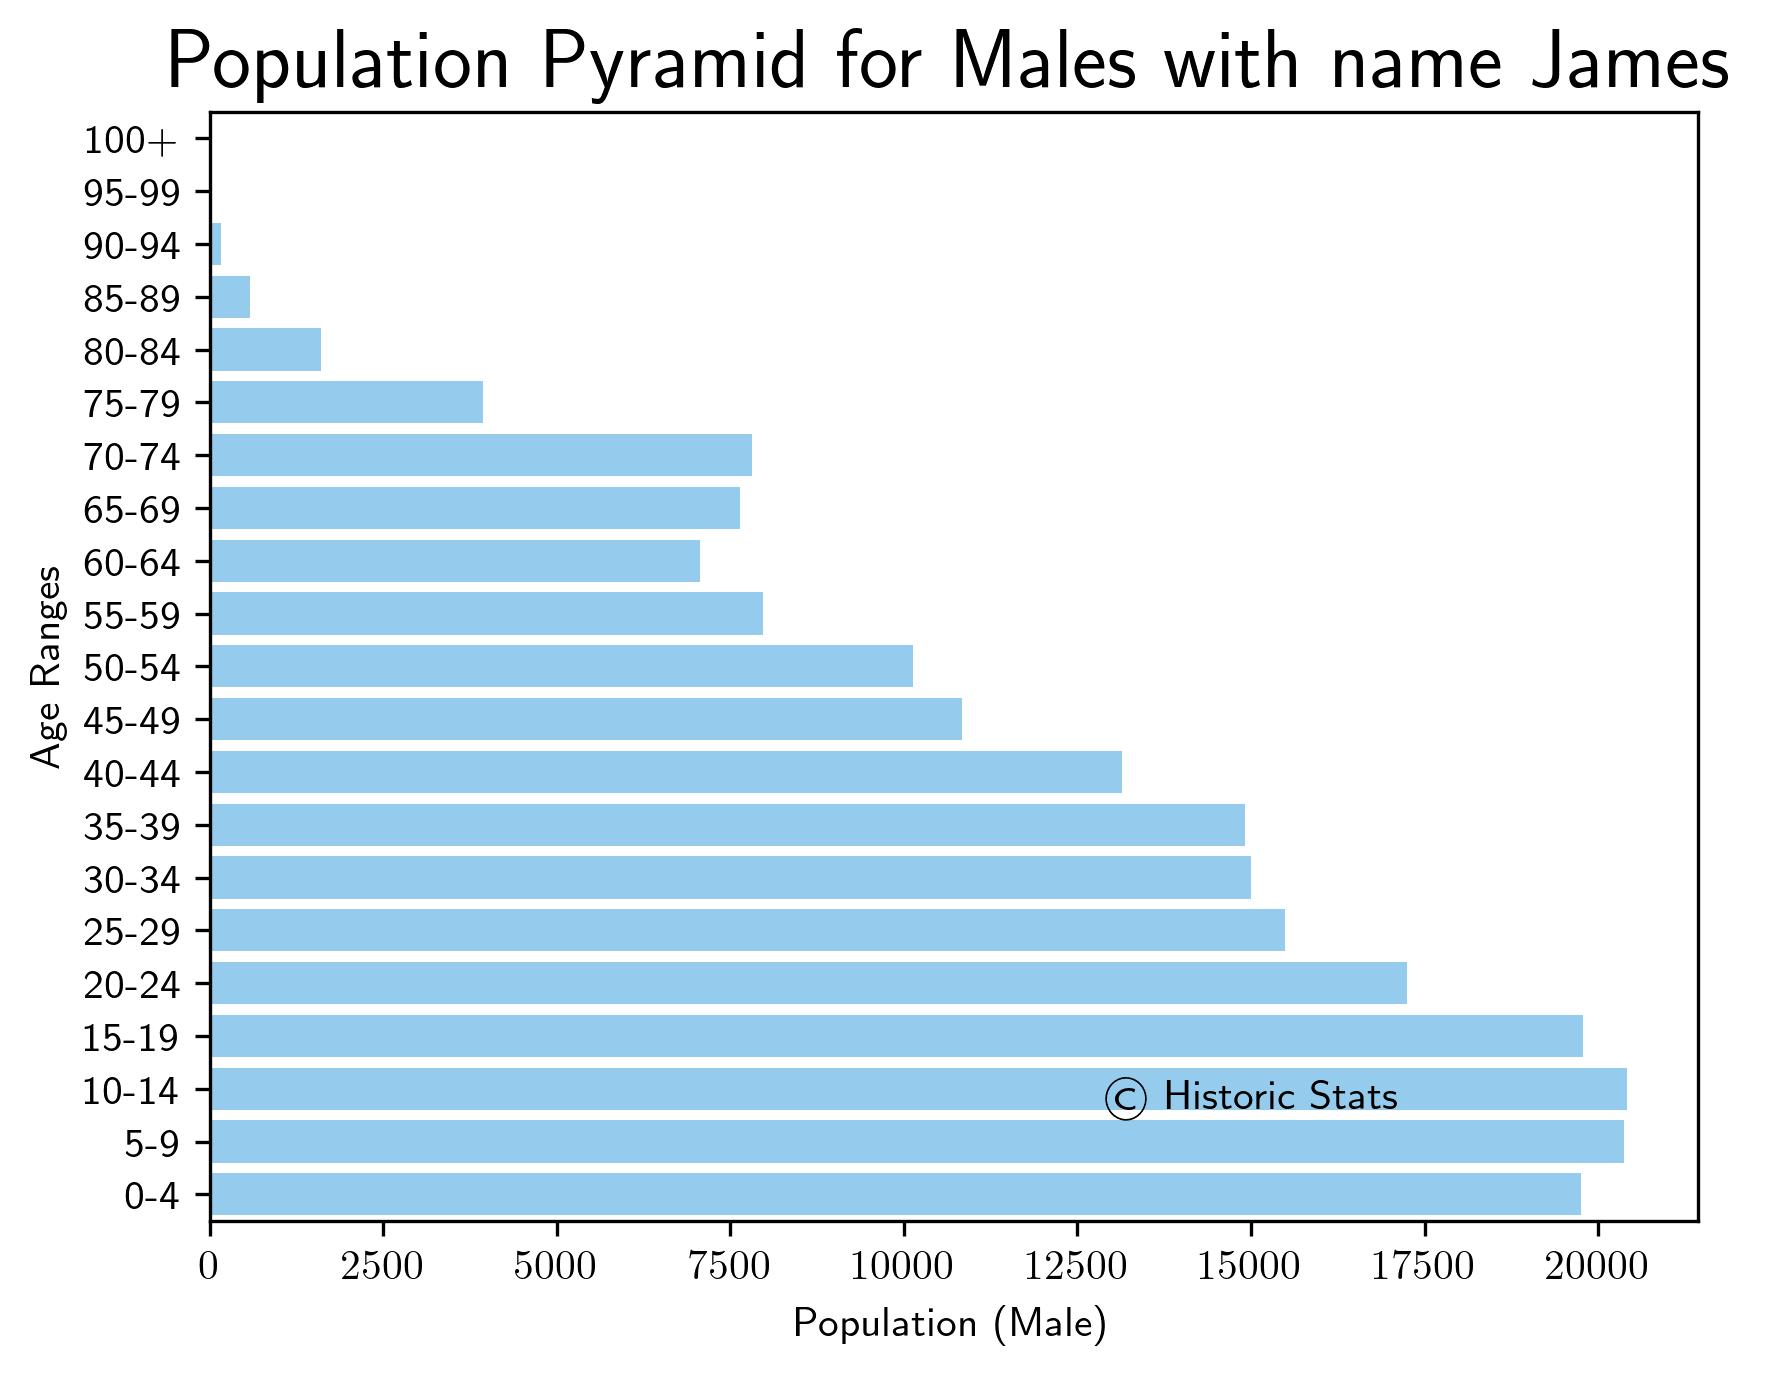
The population pyramid displays a breakdown in groups of every 5 years the number of males with the name James.
6. Religious Breakdown
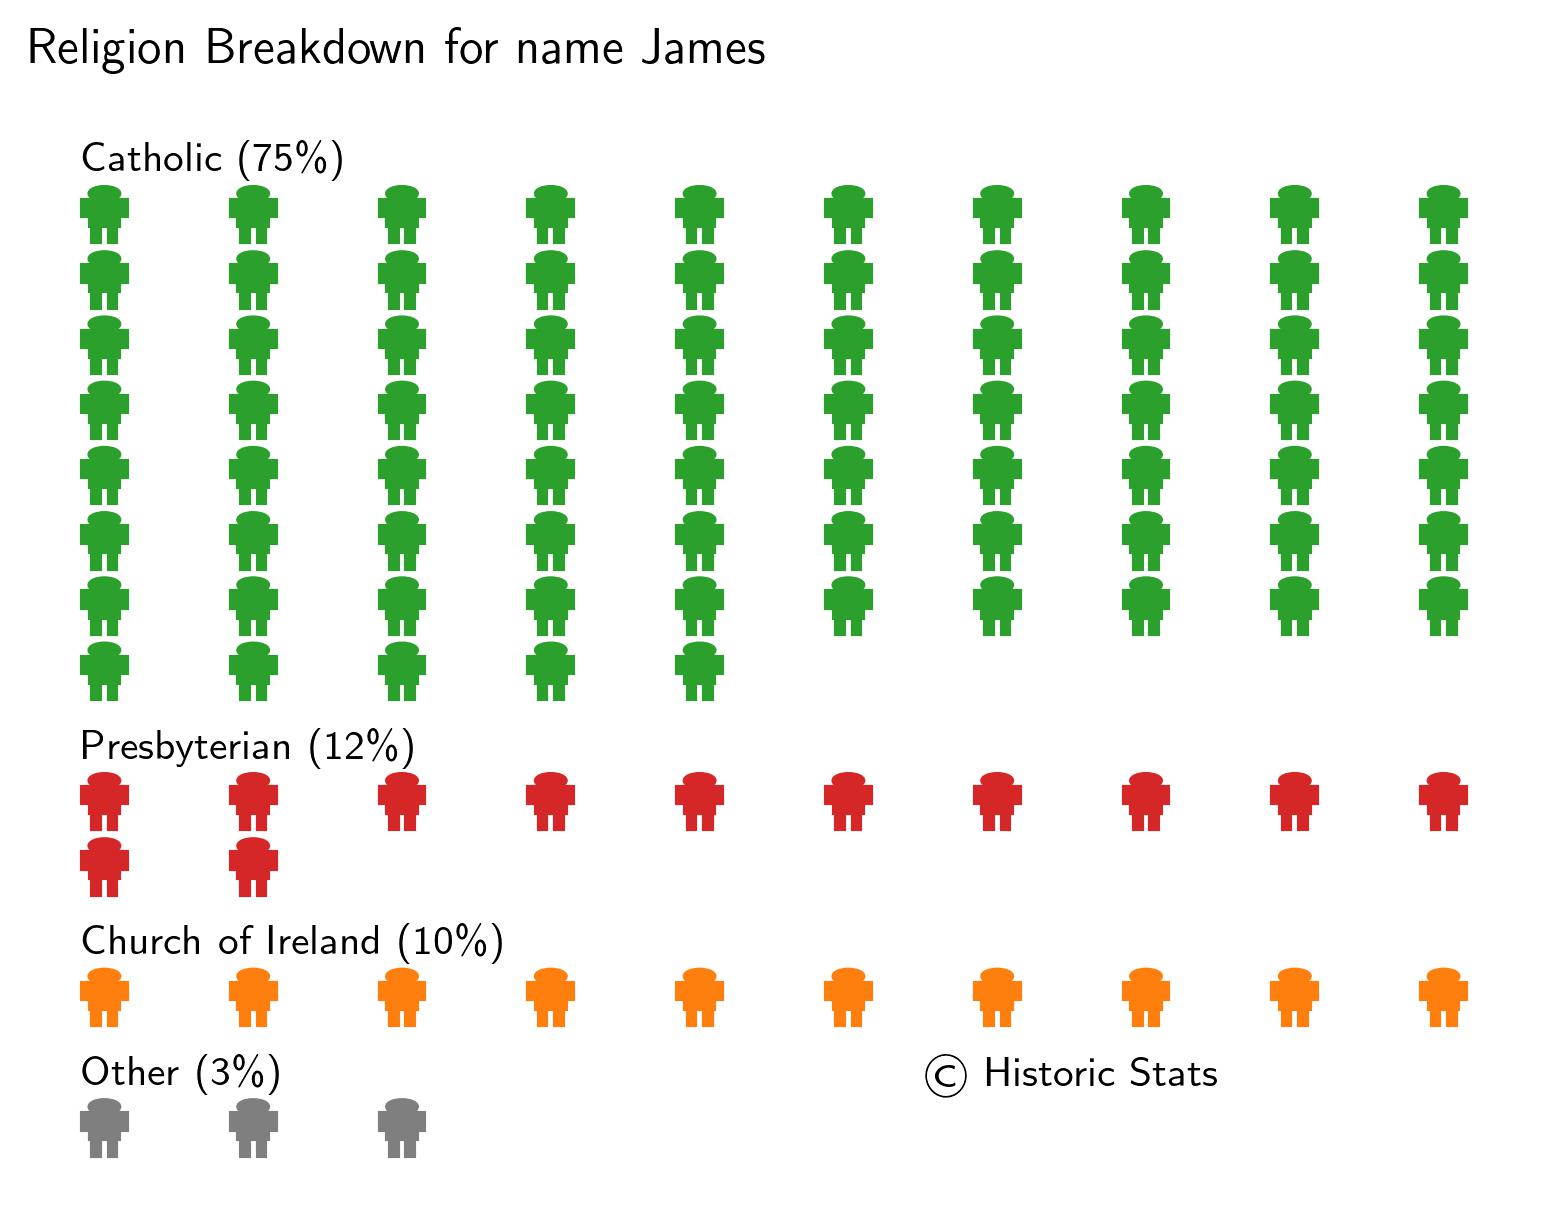
The image shown is the religious breakdown for the male population named James. Each religion has been rounded to the nearest whole percentage and any religion less than 3% has been classified as other. The most common religion was Catholic at 75.0%.
7. Occupations
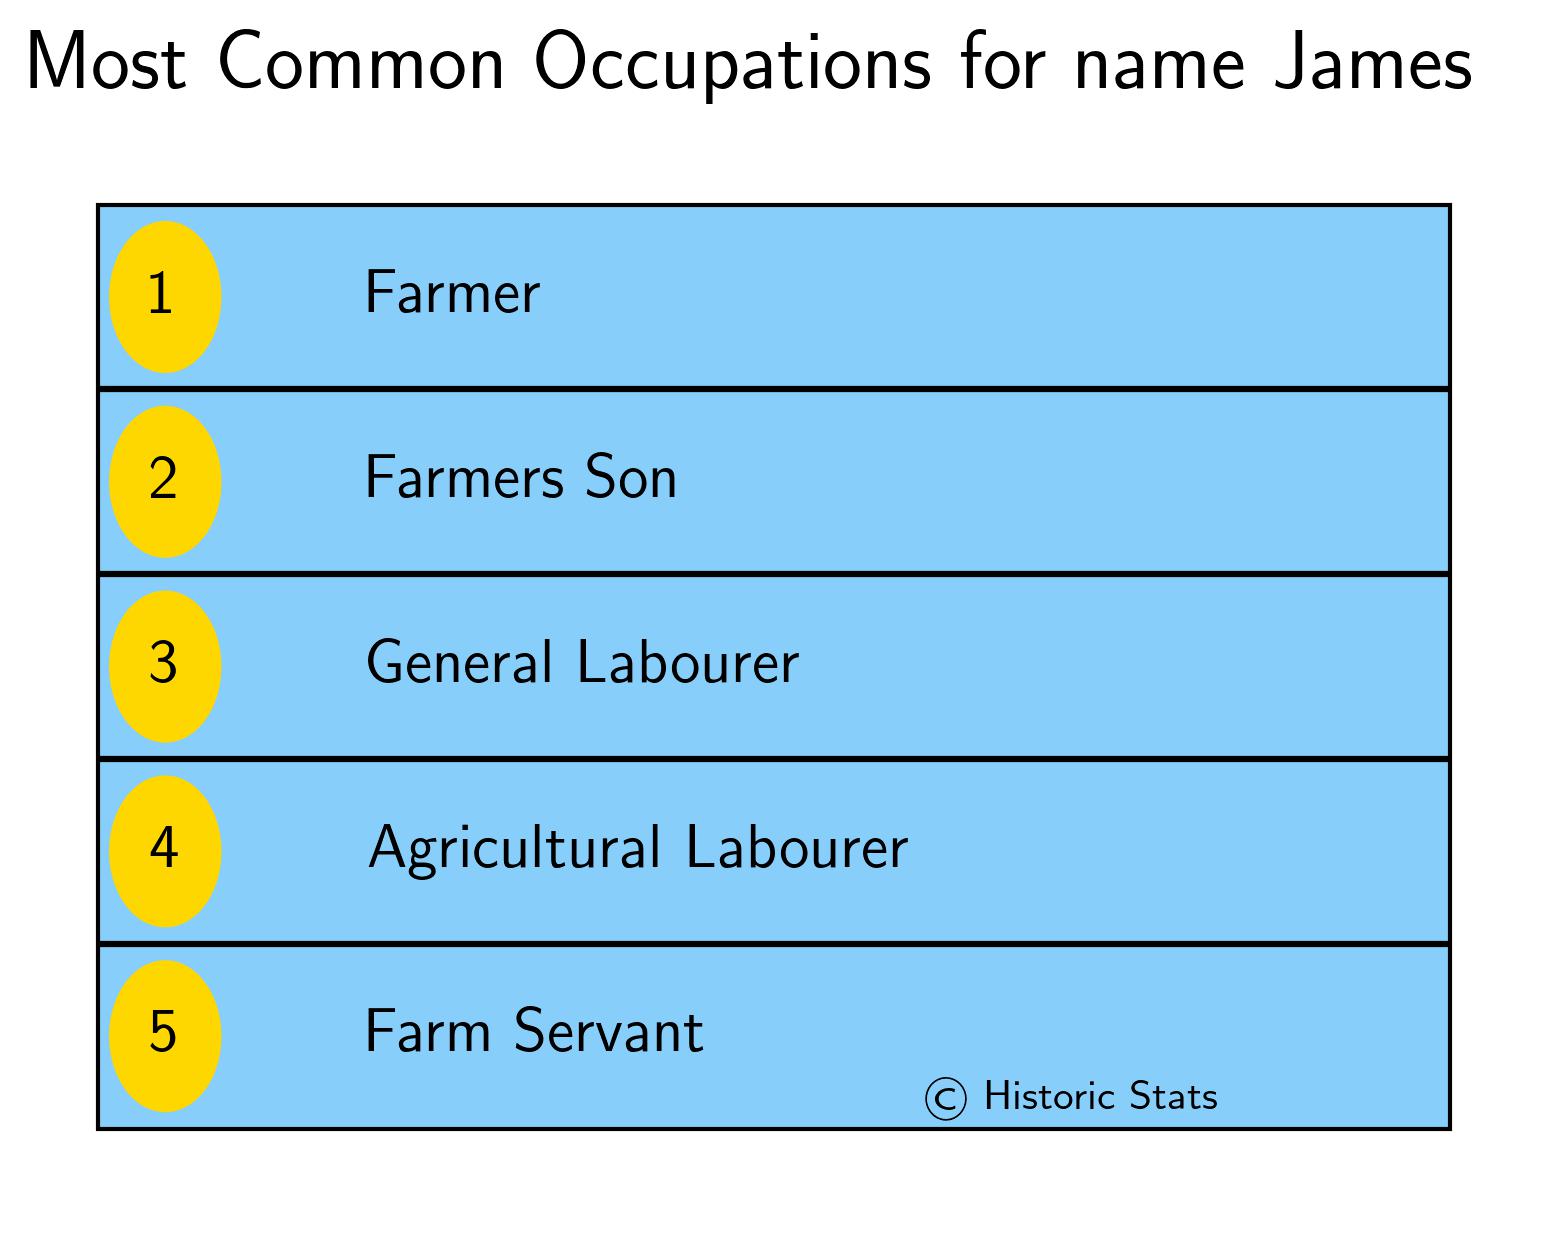
The table shown were the top 5 occupations for males with the name James. The most common occupation was Farmer at 33739 people, followed by Farmers Son at 14608 people, and General Labourer at 7919 people.
8. Birthplace by County
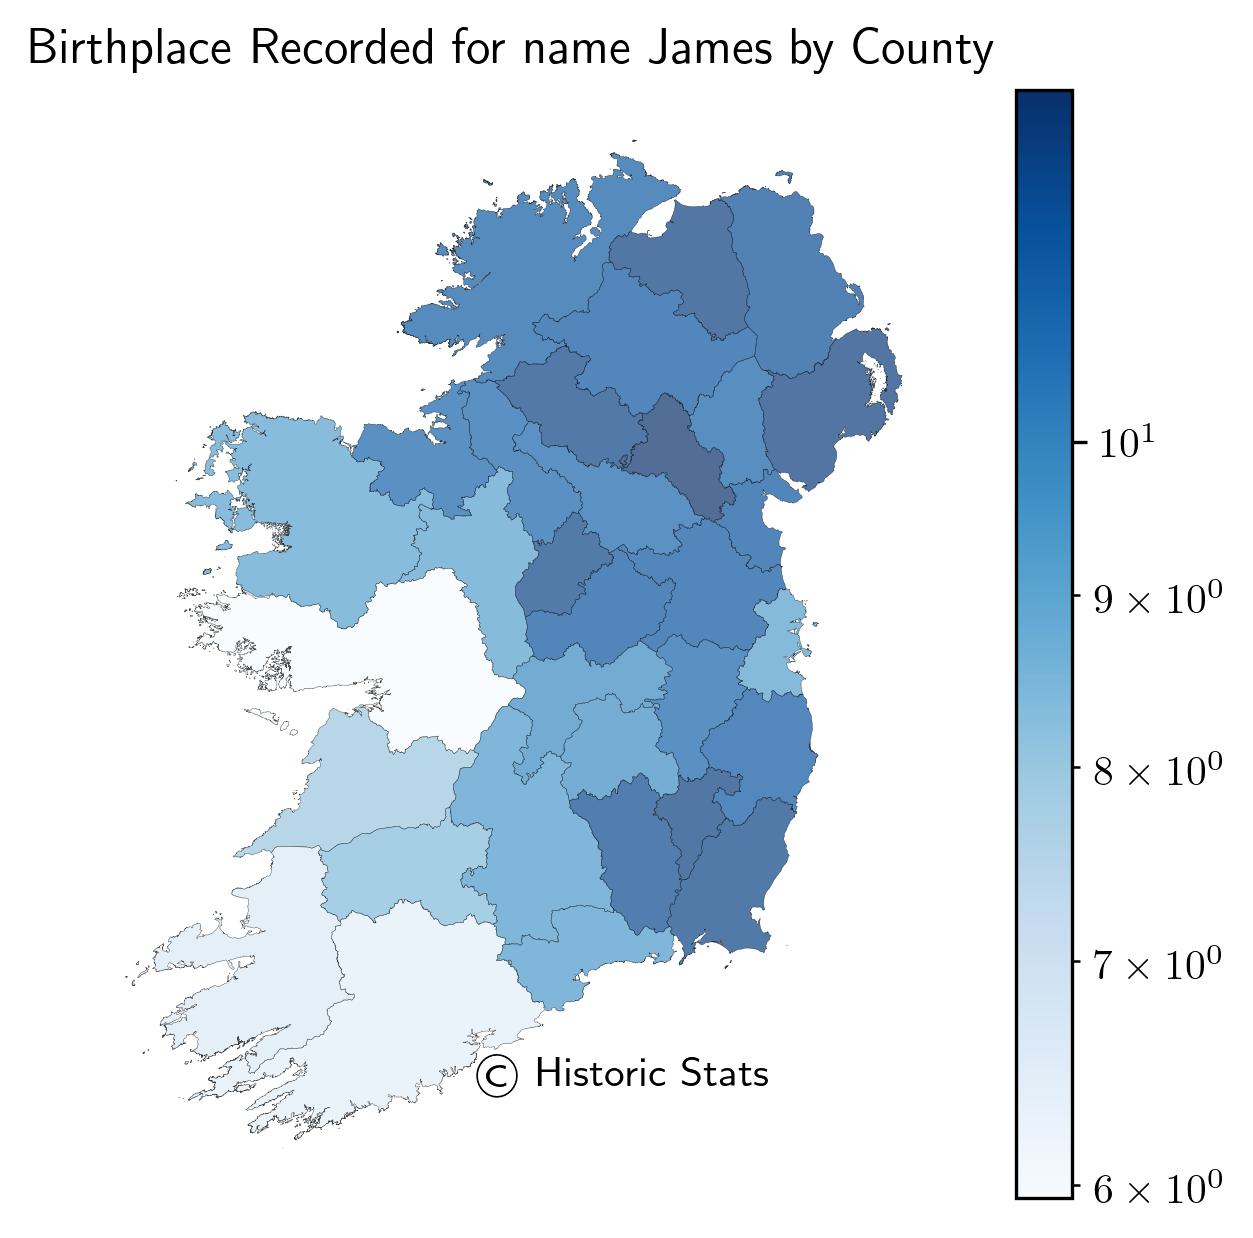
The map shown here was the proportion of the male population named James who were born in each of the counties in Ireland. Unlike the proportion of the population above, this is the reported birthplace on the census. The counties with the highest proportion from it were Monaghan at 12.74%, followed by Down at 12.3%, Londonderry at 12.22%, and Carlow at 12.22%. The proportions shown use scientific notation where the colour map uses a log norm which is discussed in the methodology section which can be viewed using the link above.
9. Literacy
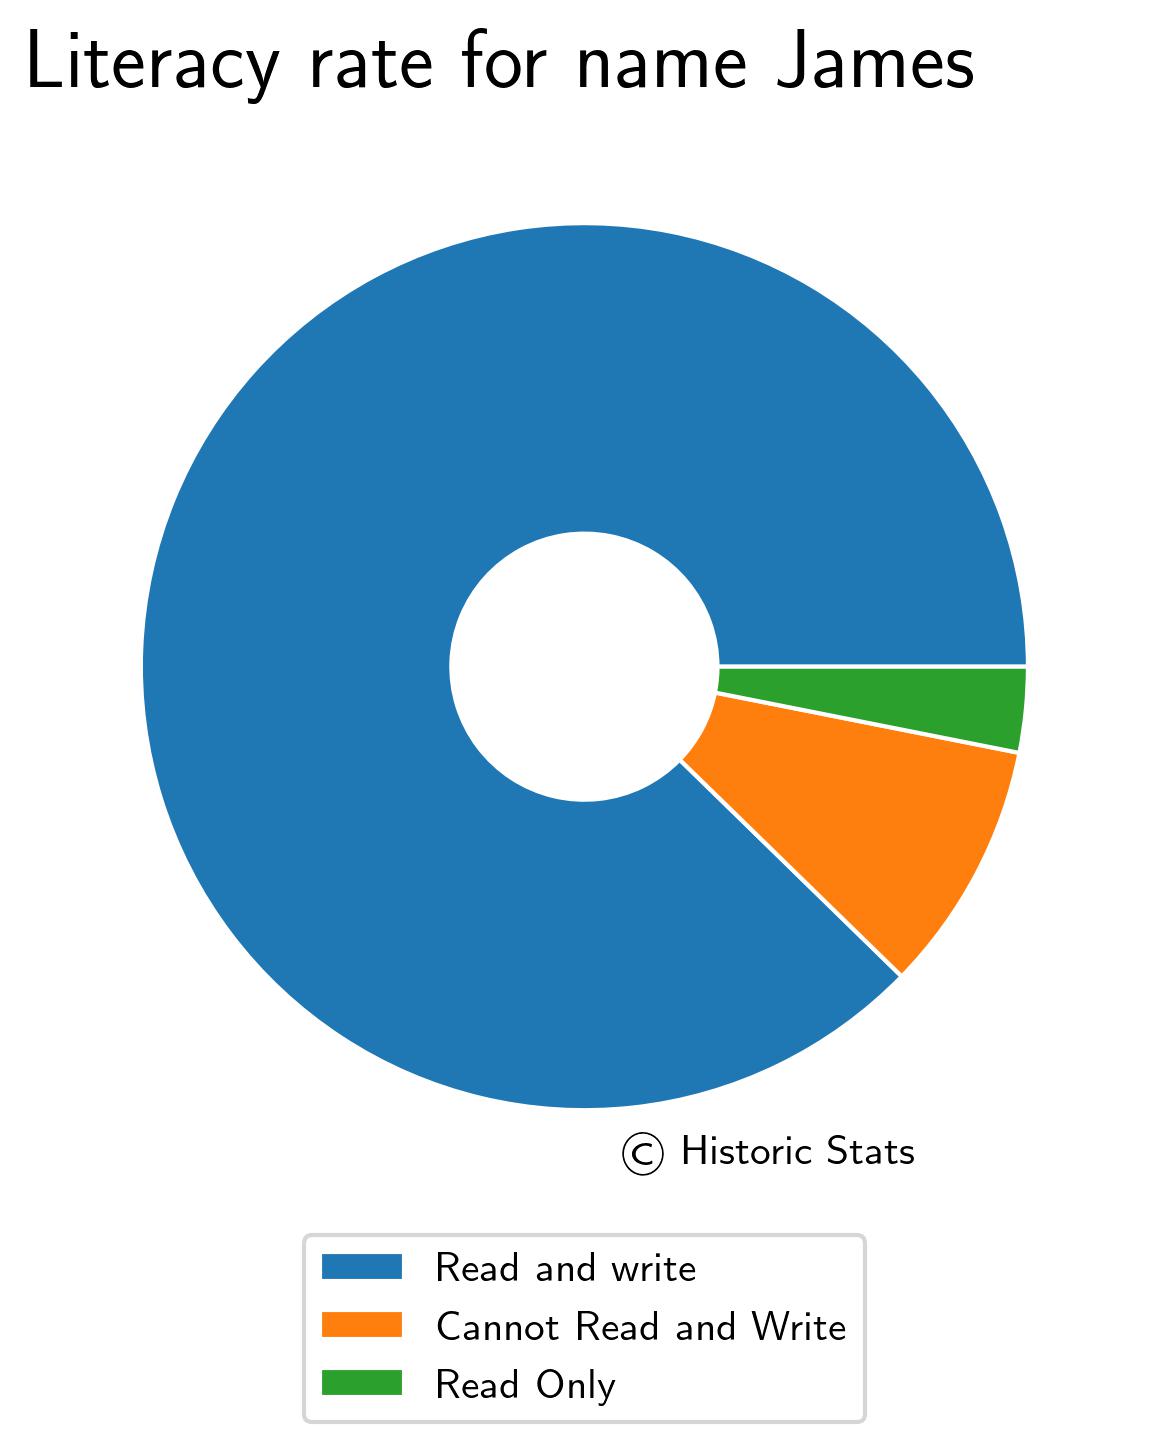
For the literacy pie chart shown, there are three categories, one for those who could read and write, another for those who could read only and the final for those who could not read or write. The pie chart is based on the population of males named James. The proportion of responses aged over 9 who can read and write were 87.69%, read only were 3.11%, and not able to read or write were 9.19%.
10. Irish Language
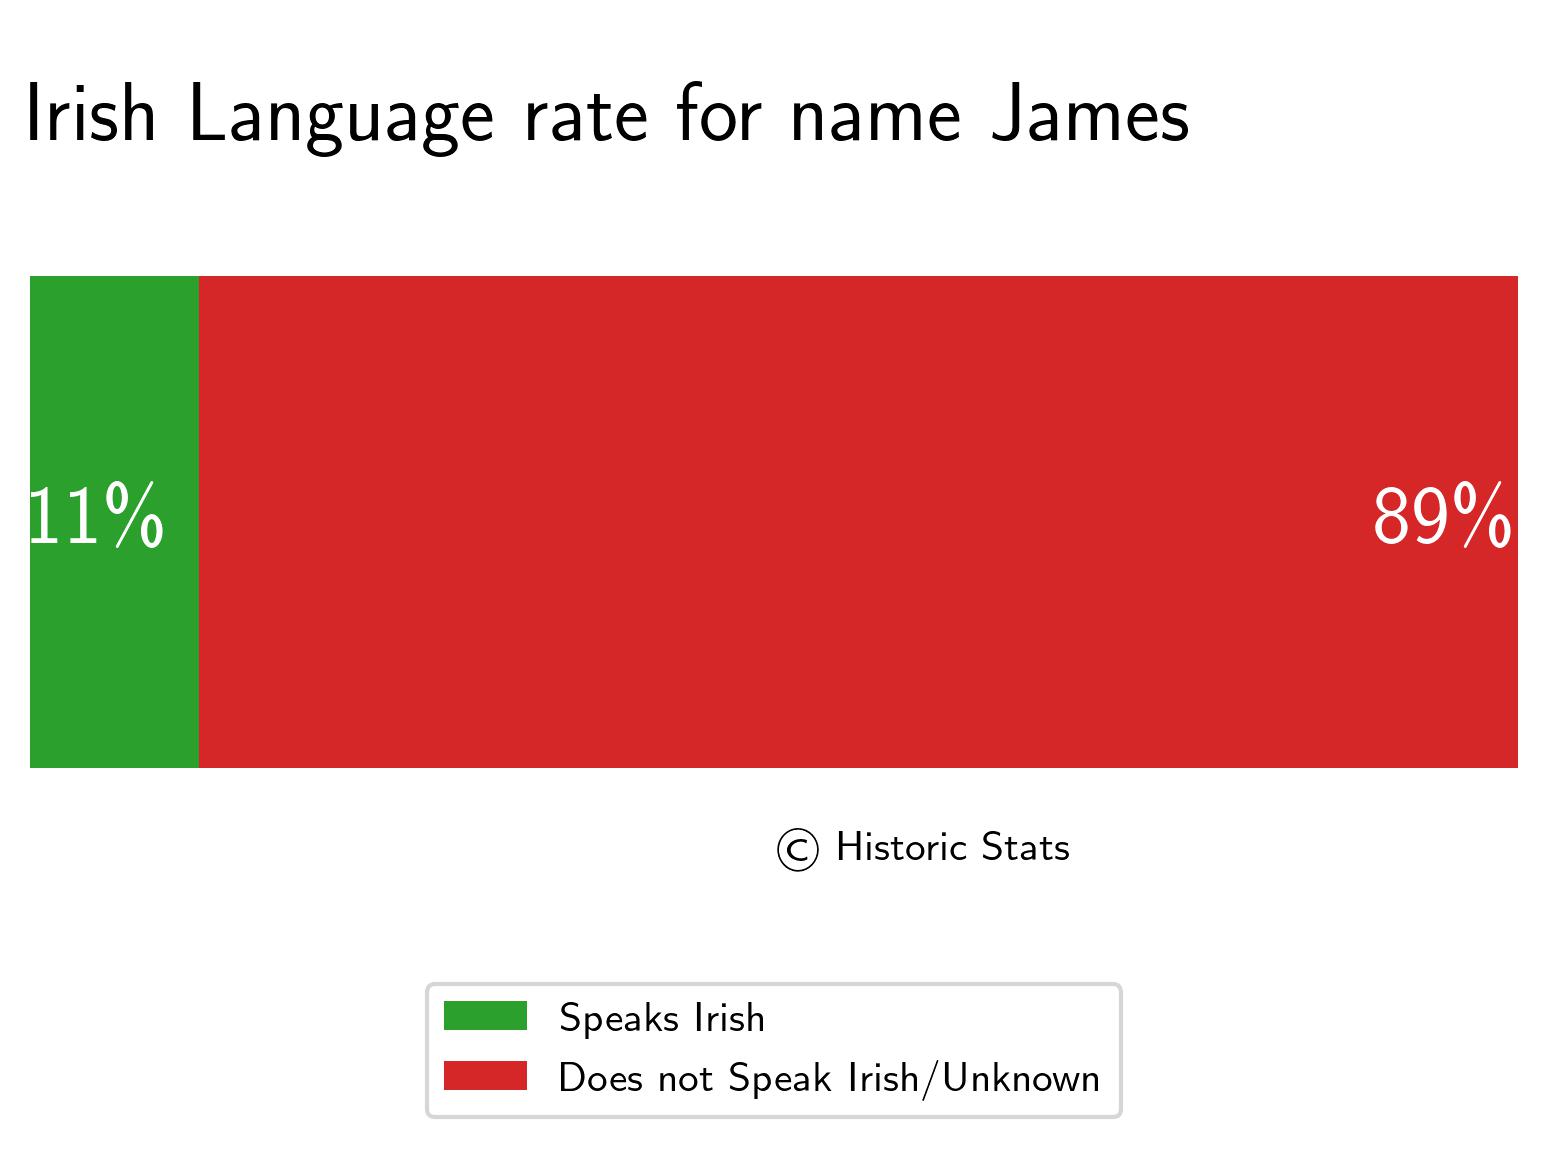
The bar shown here is the percentage (in green) who could speak Irish while the percentage in red were those who do not speak Irish or if the census entry was blank or unknown for the male population named James. The proportion who could speak Irish was 11.0%, while either not speaking Irish or unknown was 89.0%.