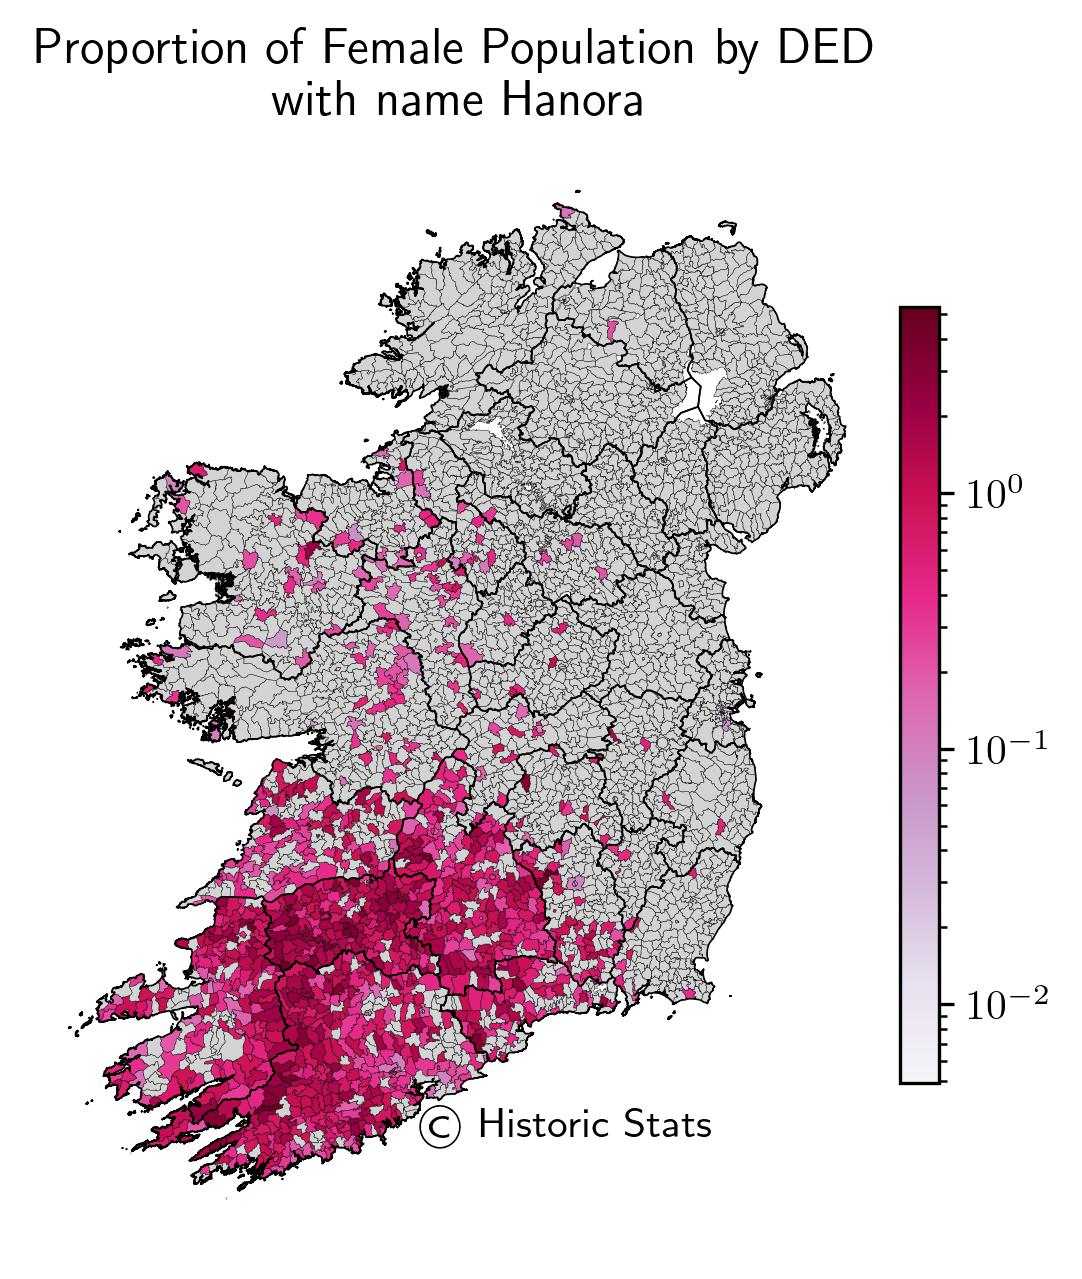
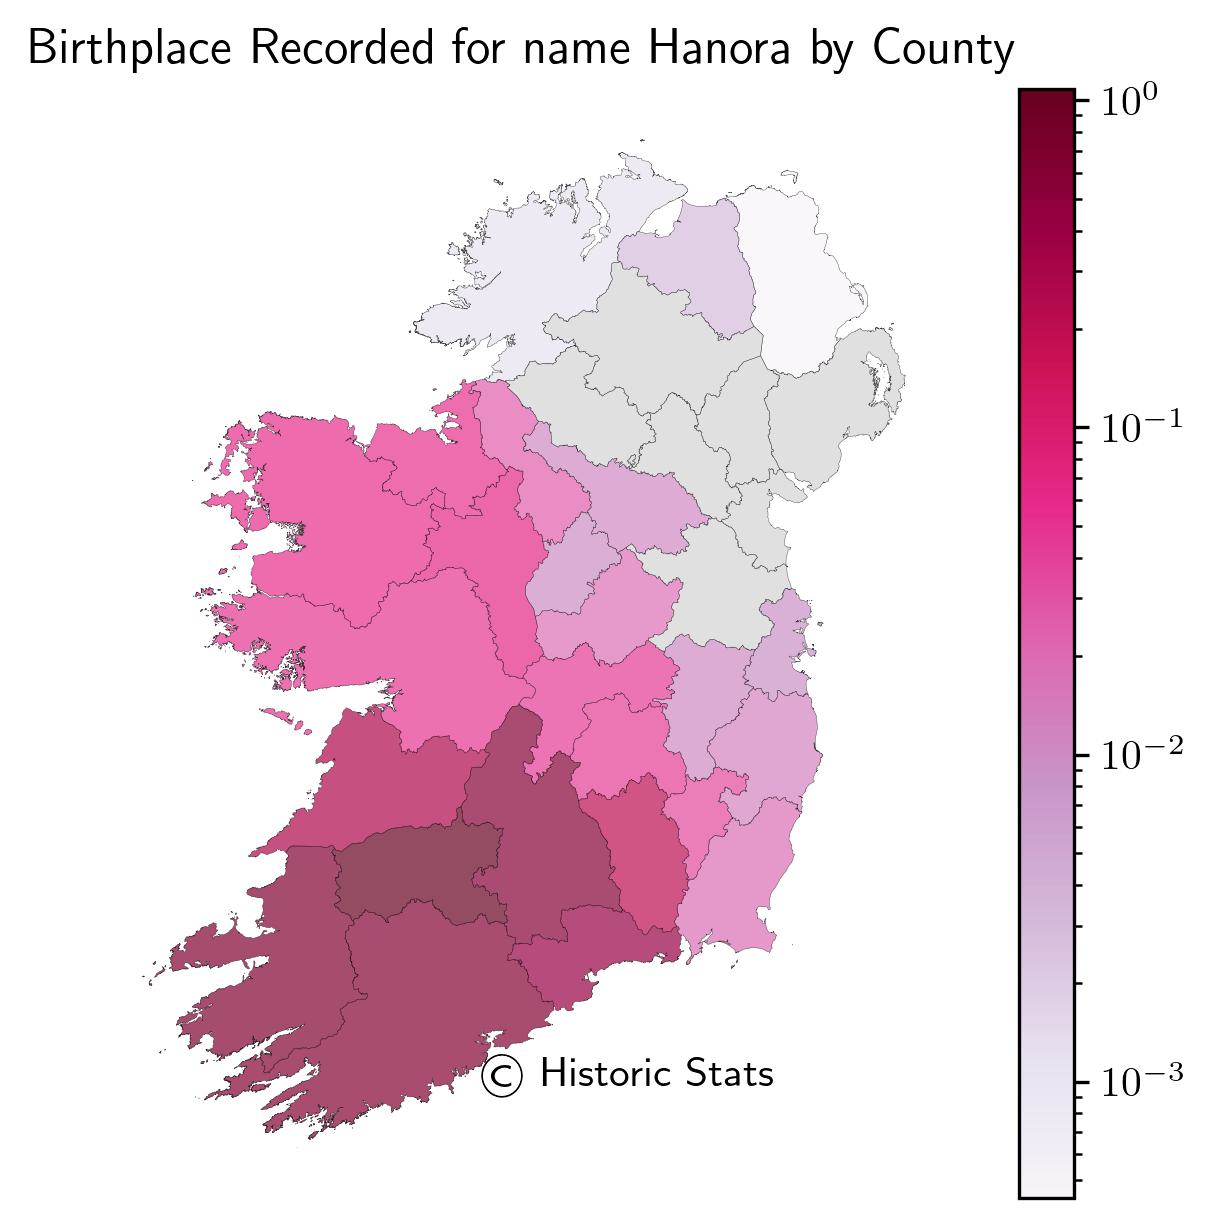
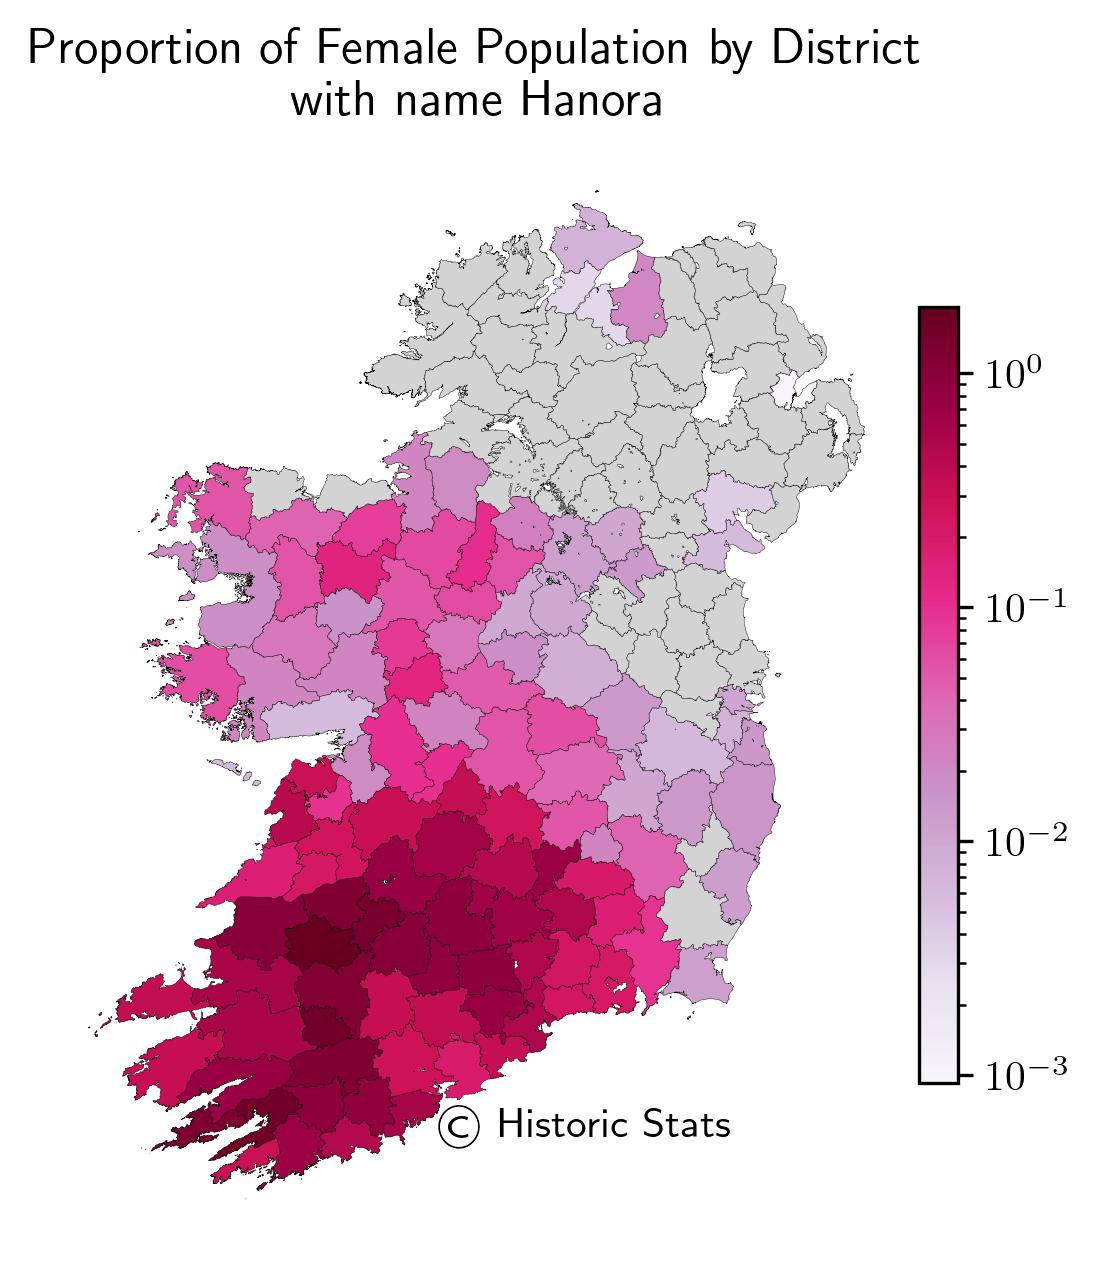
The map here shows the proportion of the female population with name Hanora by district which were also known as the Poor Law Unions. The districts with the highest proportion were Newcastlewest at 1.93%, Millstreet at 1.51%, and Bantry at 1.49%. The proportions shown use scientific notation where the colour map uses a log norm which is discussed in the methodology section which can be viewed using the link above.
The map here shows the proportion of the female population with name Hanora by DED. The electoral divisions with the highest proportion were Rathealy in County Kilkenny at 5.36%, Kealkill in County Cork at 4.97%, and Lackagh in County Tipperary at 4.69%. The proportions shown use scientific notation where the colour map uses a log norm which is discussed in the methodology section which can be viewed using the link above.
The pie chart shows the marital status of the female population named Hanora. This is either single, married, or widow or widower. The proportion of responses aged over 15 who were single were 25.97%, married were 45.07%, and either widowed or widow were 28.96%.
The table shown here displays the top 10 surnames by the number of females who had the name Hanora. These surnames are grouped regardless of common prefixes such as "O", "Mac" and "Mc". The most common surname was Sullivan at 121 people, followed by Murphy at 88 people, Ryan at 58 people, and Brien at 56 people.
The population pyramid displays a breakdown in groups of every 5 years the number of females with the name Hanora.
The image shown is the religious breakdown for the female population named Hanora. Each religion has been rounded to the nearest whole percentage and any religion less than 3% has been classified as other. The most common religion was Catholic at 100.0%.
The table shown were the top 5 occupations for females with the name Hanora. The most common occupation was Farmer at 222 people, followed by Farmers Daughter at 59 people, and Domestic Servant at 53 people.
The map shown here was the proportion of the female population named Hanora who were born in each of the counties in Ireland. Unlike the proportion of the population above, this is the reported birthplace on the census. The counties with the highest proportion from it were Limerick at 1.08%, followed by Kerry at 0.63%, Cork at 0.59%, and Tipperary at 0.58%. The proportions shown use scientific notation where the colour map uses a log norm which is discussed in the methodology section which can be viewed using the link above.
For the literacy pie chart shown, there are three categories, one for those who could read and write, another for those who could read only and the final for those who could not read or write. The pie chart is based on the population of females named Hanora. The proportion of responses aged over 9 who can read and write were 76.6%, read only were 4.78%, and not able to read or write were 18.62%.
The bar shown here is the percentage (in green) who could speak Irish while the percentage in red were those who do not speak Irish or if the census entry was blank or unknown for the female population named Hanora. The proportion who could speak Irish was 30.0%, while either not speaking Irish or unknown was 70.0%.